Rating TV Shows Using Linear Regression
A few days ago, I was browsing through my numerous streaming services looking for a new show to start. The Blacklist peaked my interest, as I had seen it pop up before and never really gave it a shot. But 10 seasons, now that’s a commitment. Not wanting to jump into it right away, I went to see what Reddit had to say. It seemed the consensus was that the show started out well, but due to the decline in writing quality was not worth finishing. Others suggested that Person of Interest would be a better watch.
An idea began forming in my mind: What if I could use individual episode ratings to get a better picture of how a show performs over time? IMDB had just the data that I needed, but it turns out they don’t like handing out API access for personal use. They did however, send me an email pointing me to their free data set, which allowed me to download the needed data in tsv format. How neat. With a simple python conversion to csv I was easily able to import the data sets into my local MySQL database using DBeaver.
Using the csv files was actually sufficient as first to get charts going with Matplotlib, but sql became much more efficient later when aggregating.
If you are interesting in playing around with this data yourself, you can follow these steps
Plotting the Data
Using the episode ratings, I plotted my first chart.
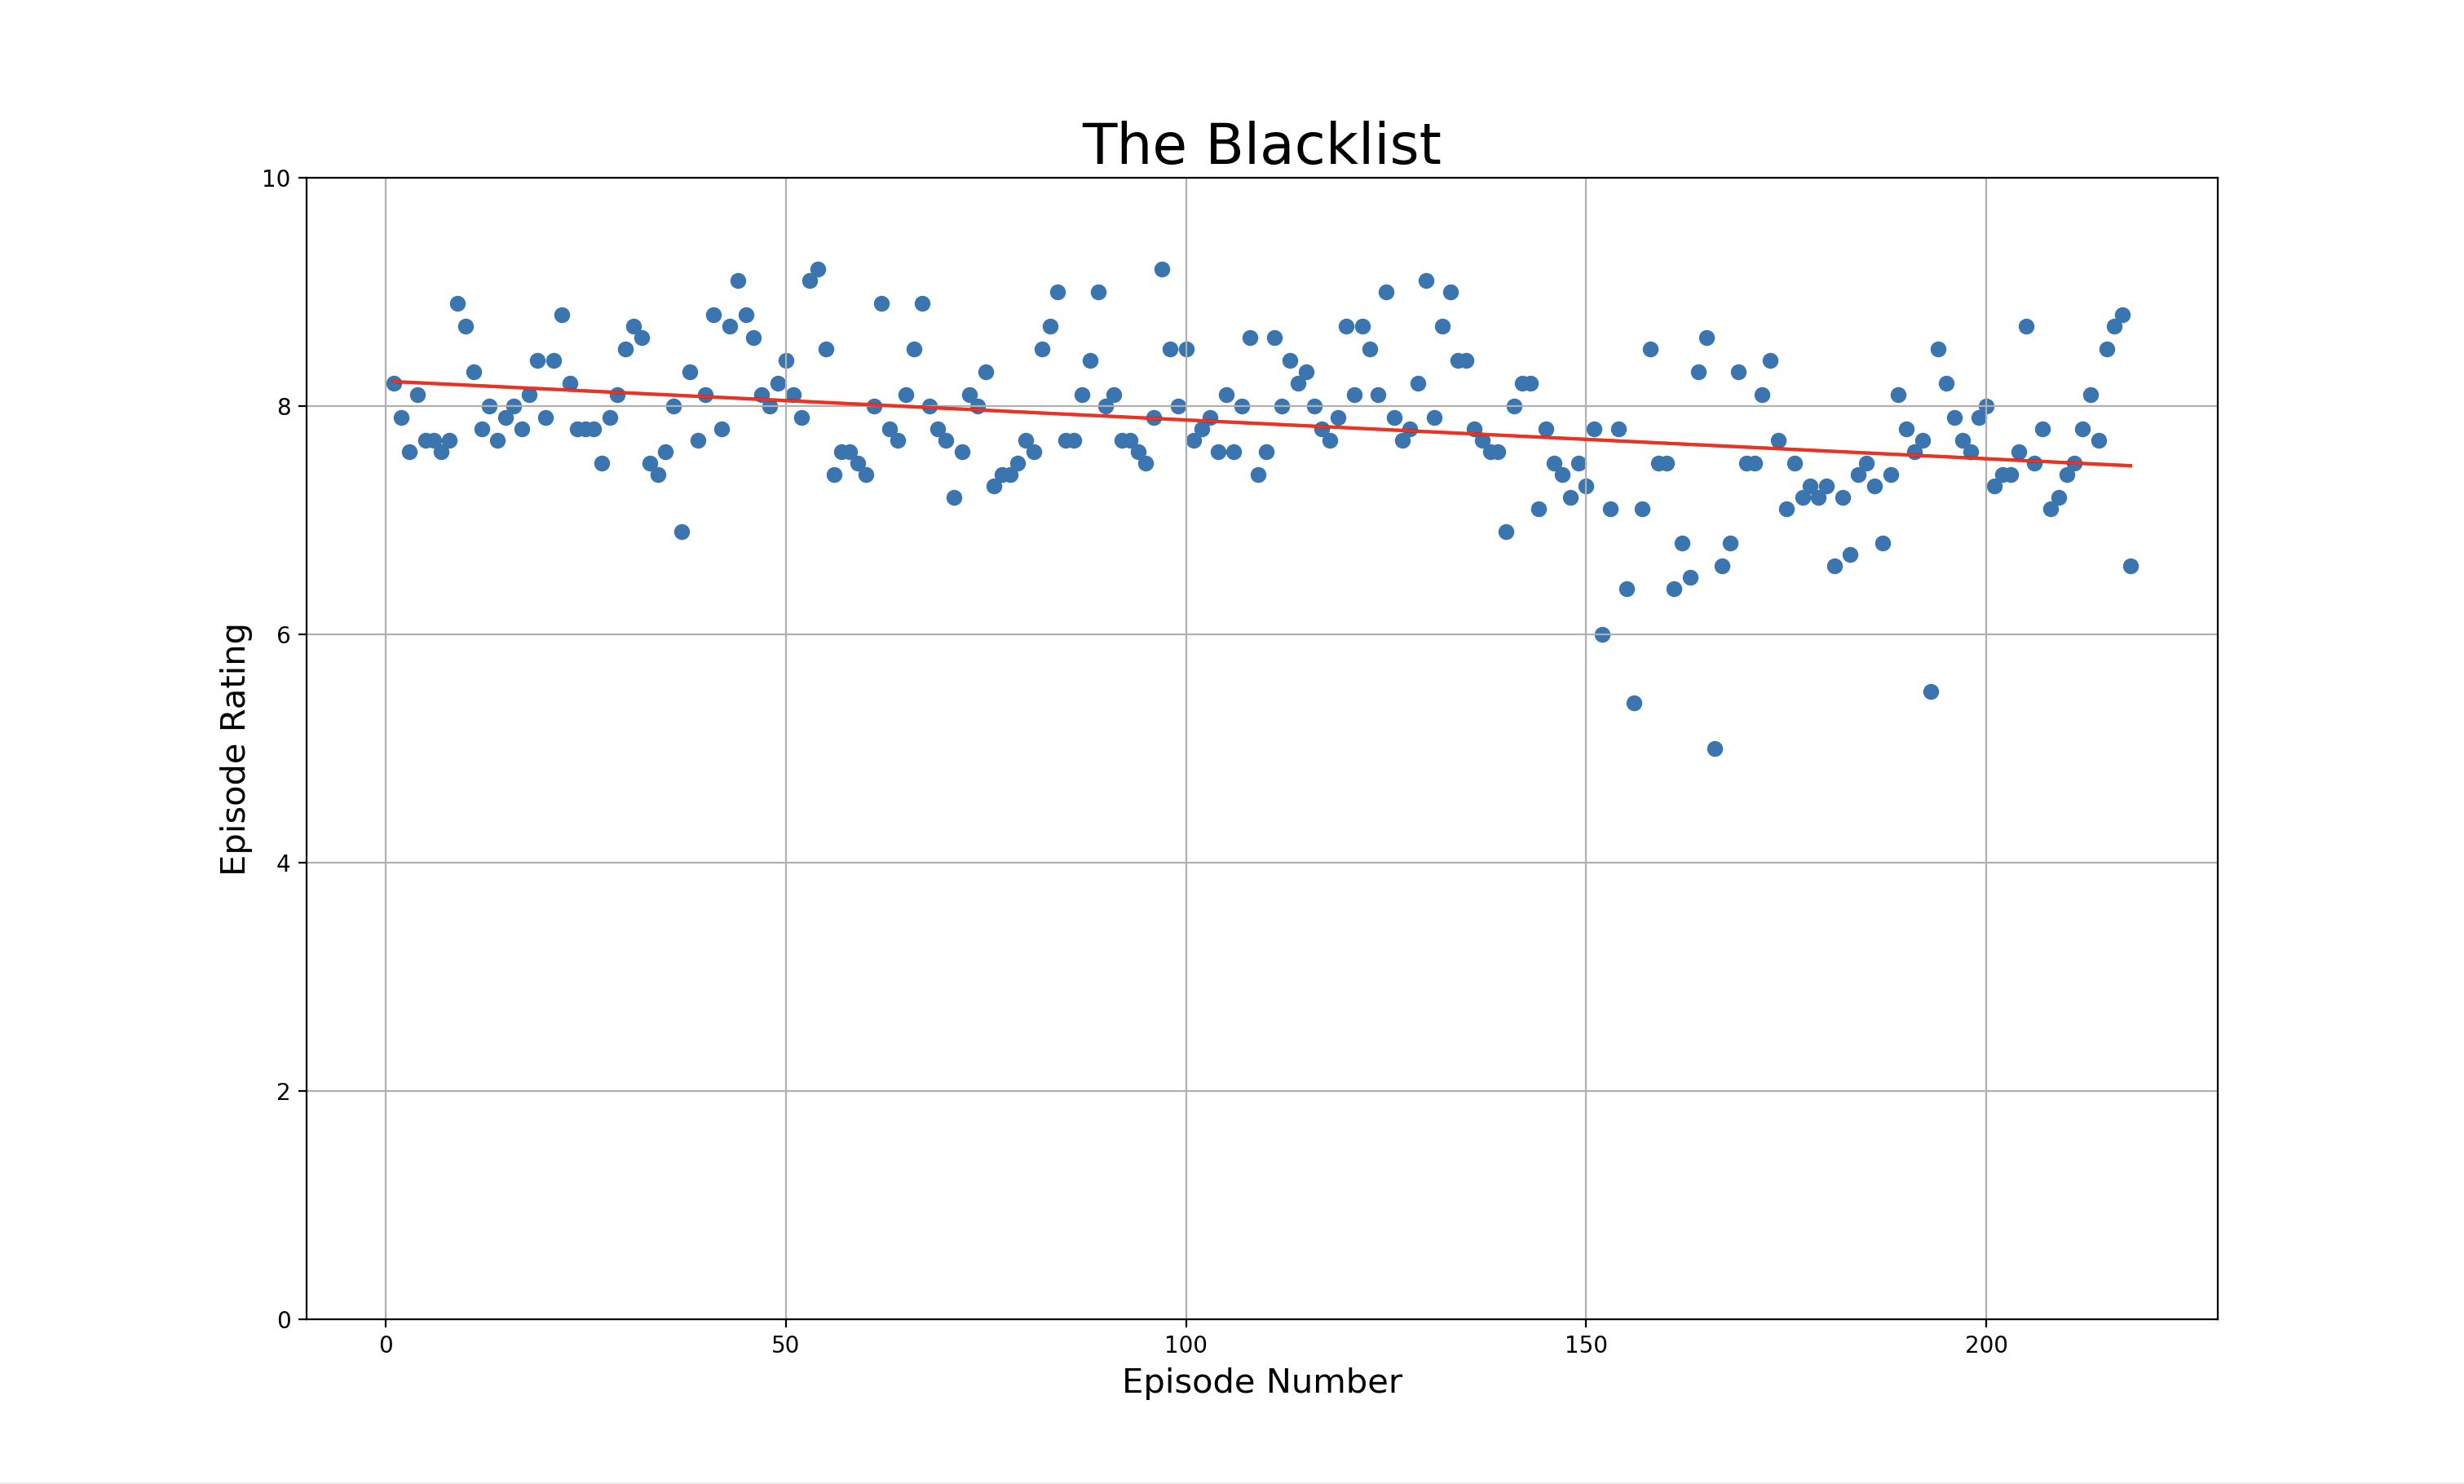
This data might be interesting to look at, but it did not help me with my ultimate goal, which was to compare these results to other tv shows. Enter linear regression.
“Linear regression is a statistical model which estimates the linear relationship between a scalar response and one or more explanatory variables.” - Wikipedia
Simple put, It helps us draw a linear line that best fits a set of points. The slope of that line is what we are untimely trying to find.
You are hopefully familiar with the slope-intercept form of the equation for a straight line.
\[y = mx + b\]Given that all the points in our data set fall on a straight line, this equation is useful to find the slope. However, we need something a little more complex to fit our scattered points.
\[\beta = \frac{\sum_{i=1}^n (x_i-\bar{x})(y_i-\bar{y})}{\sum_{i=1}^n (x_i-\bar{x})^2}\]Here, \(\beta\) is the slope of the fitted line. From this point on, lets refer to it as the M score
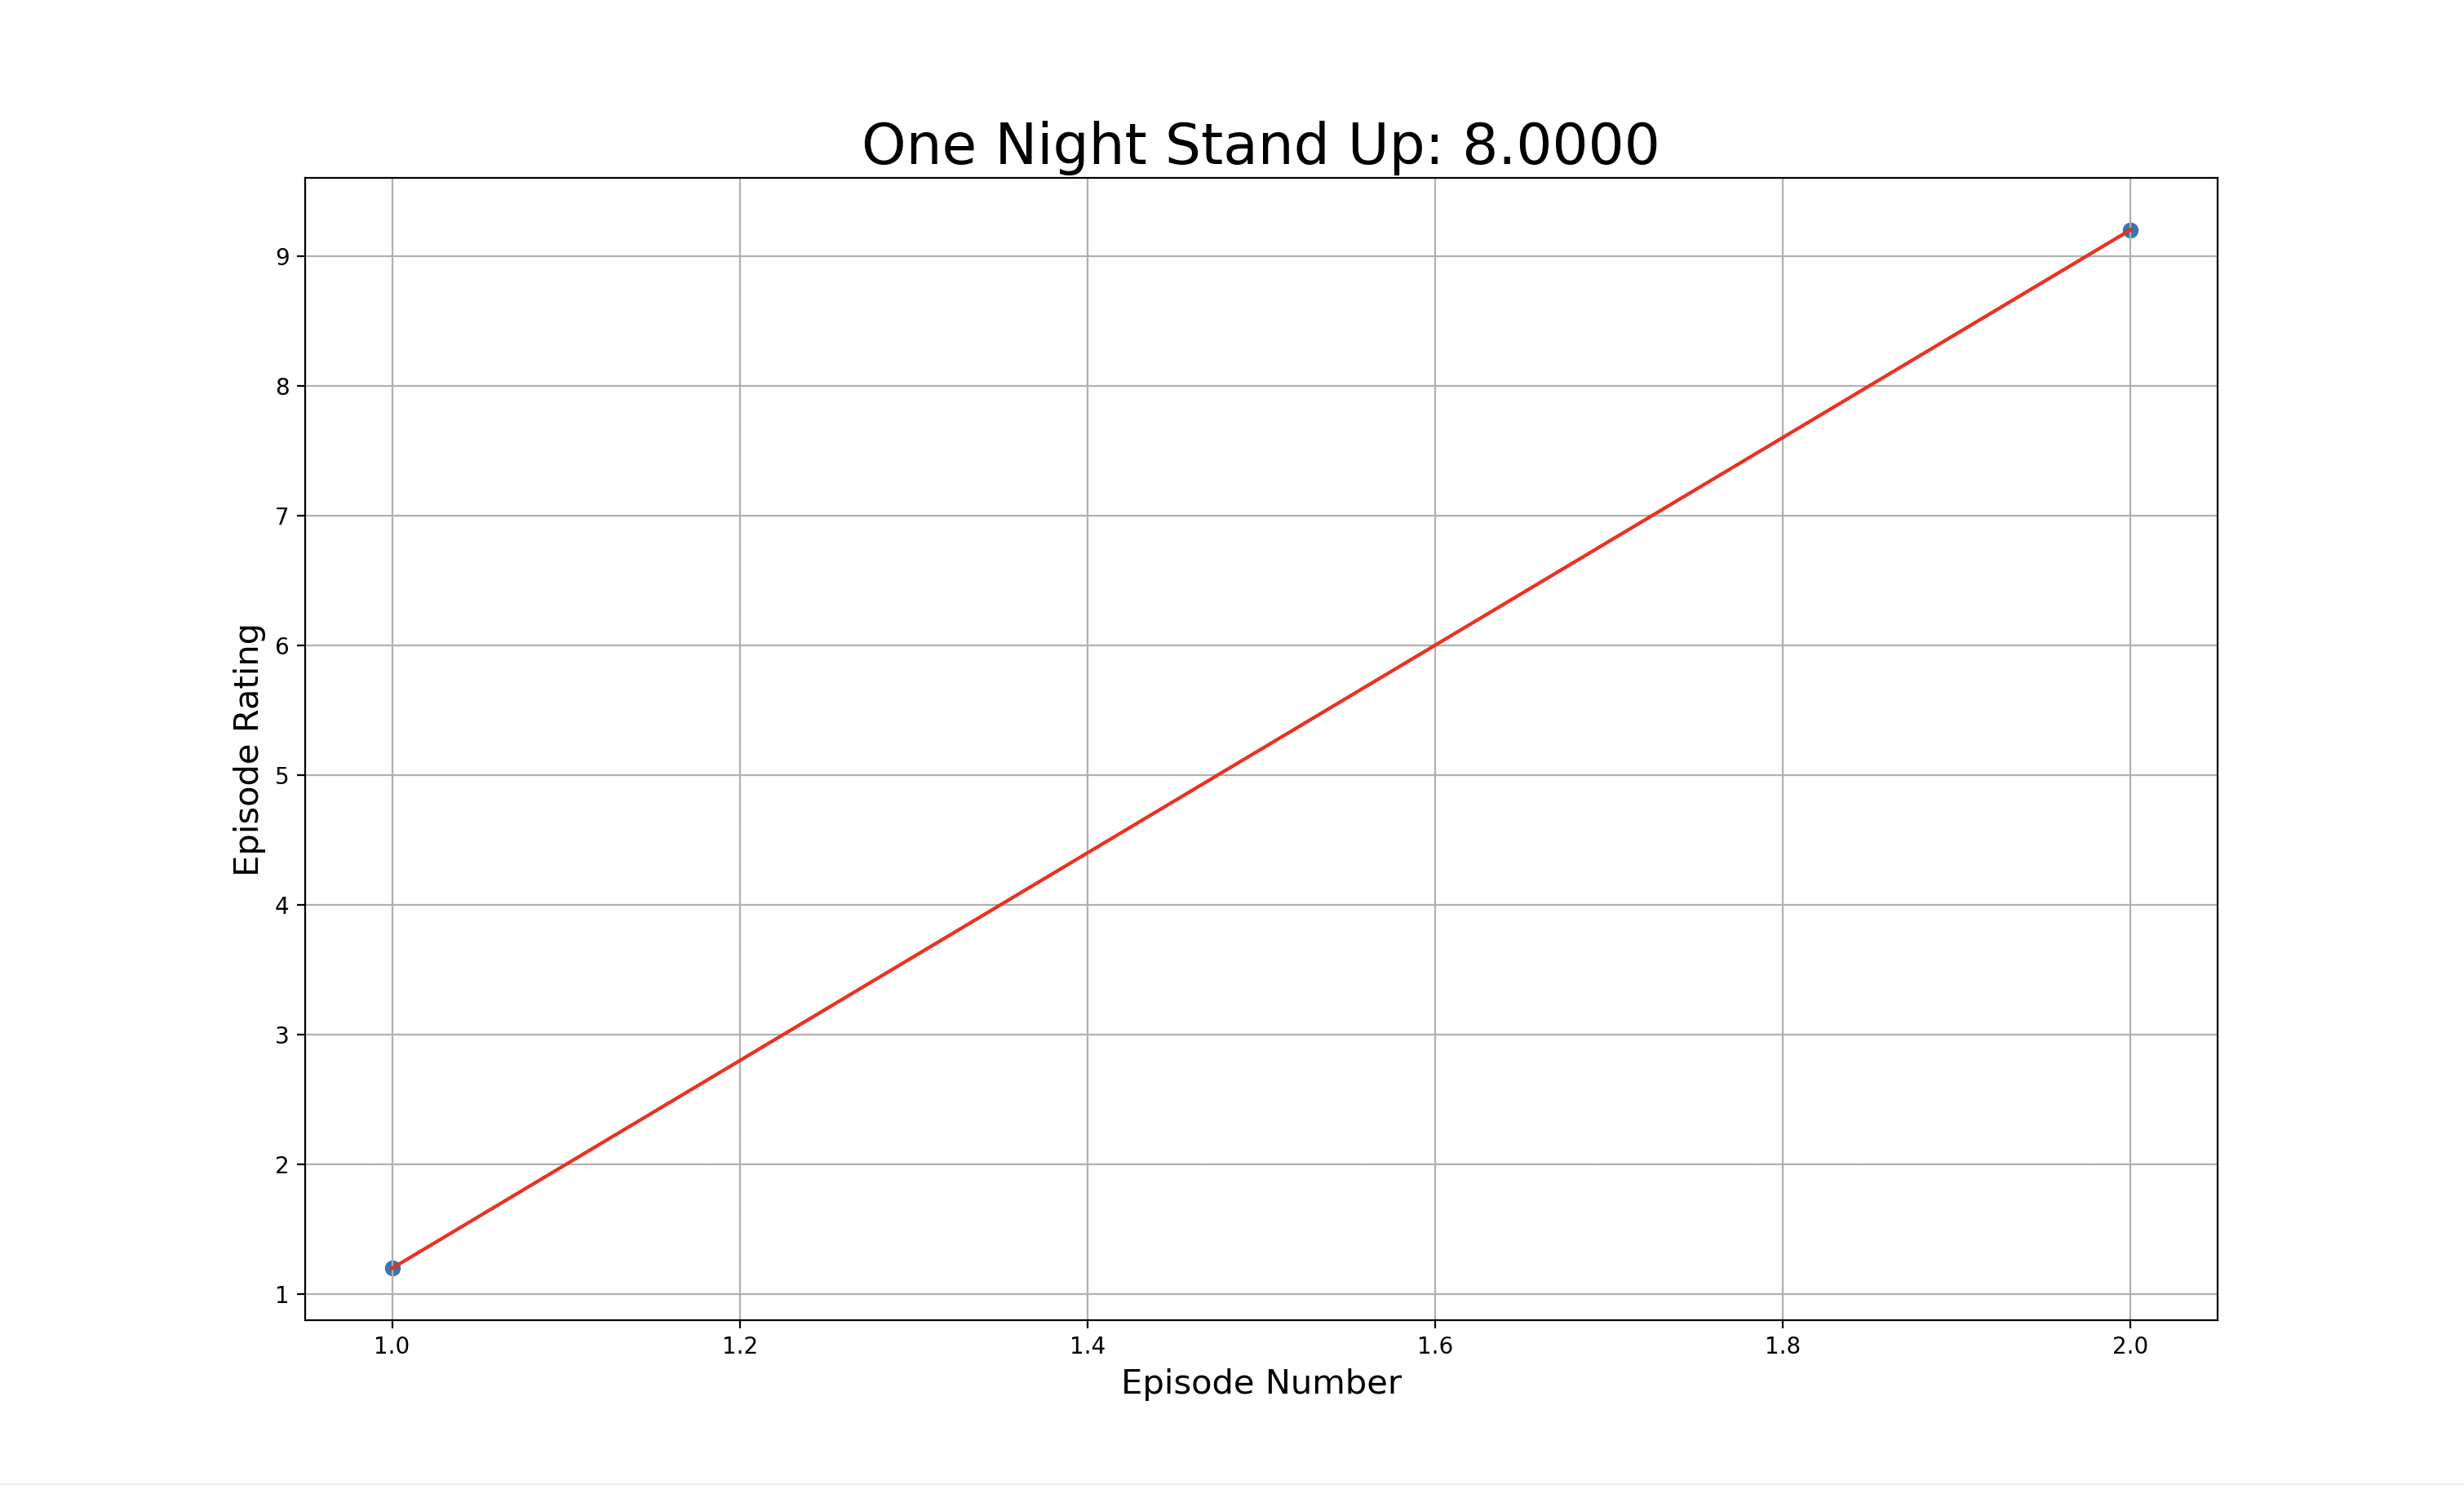
Lets imagine there is a TV show that only aired 2 episodes. The first episode got a rating of 0/10 and the second episode got a rating of 10/10. This would give us an M score of 10. Similarly, if the ratings were reversed the M score would be -10. Thus, we have our limits \(-10 \leq M \leq 10\). A score of \(0\) would mean that every episode in the show got the same rating. Interesting, the M score for most tv shows is very close to \(0\).
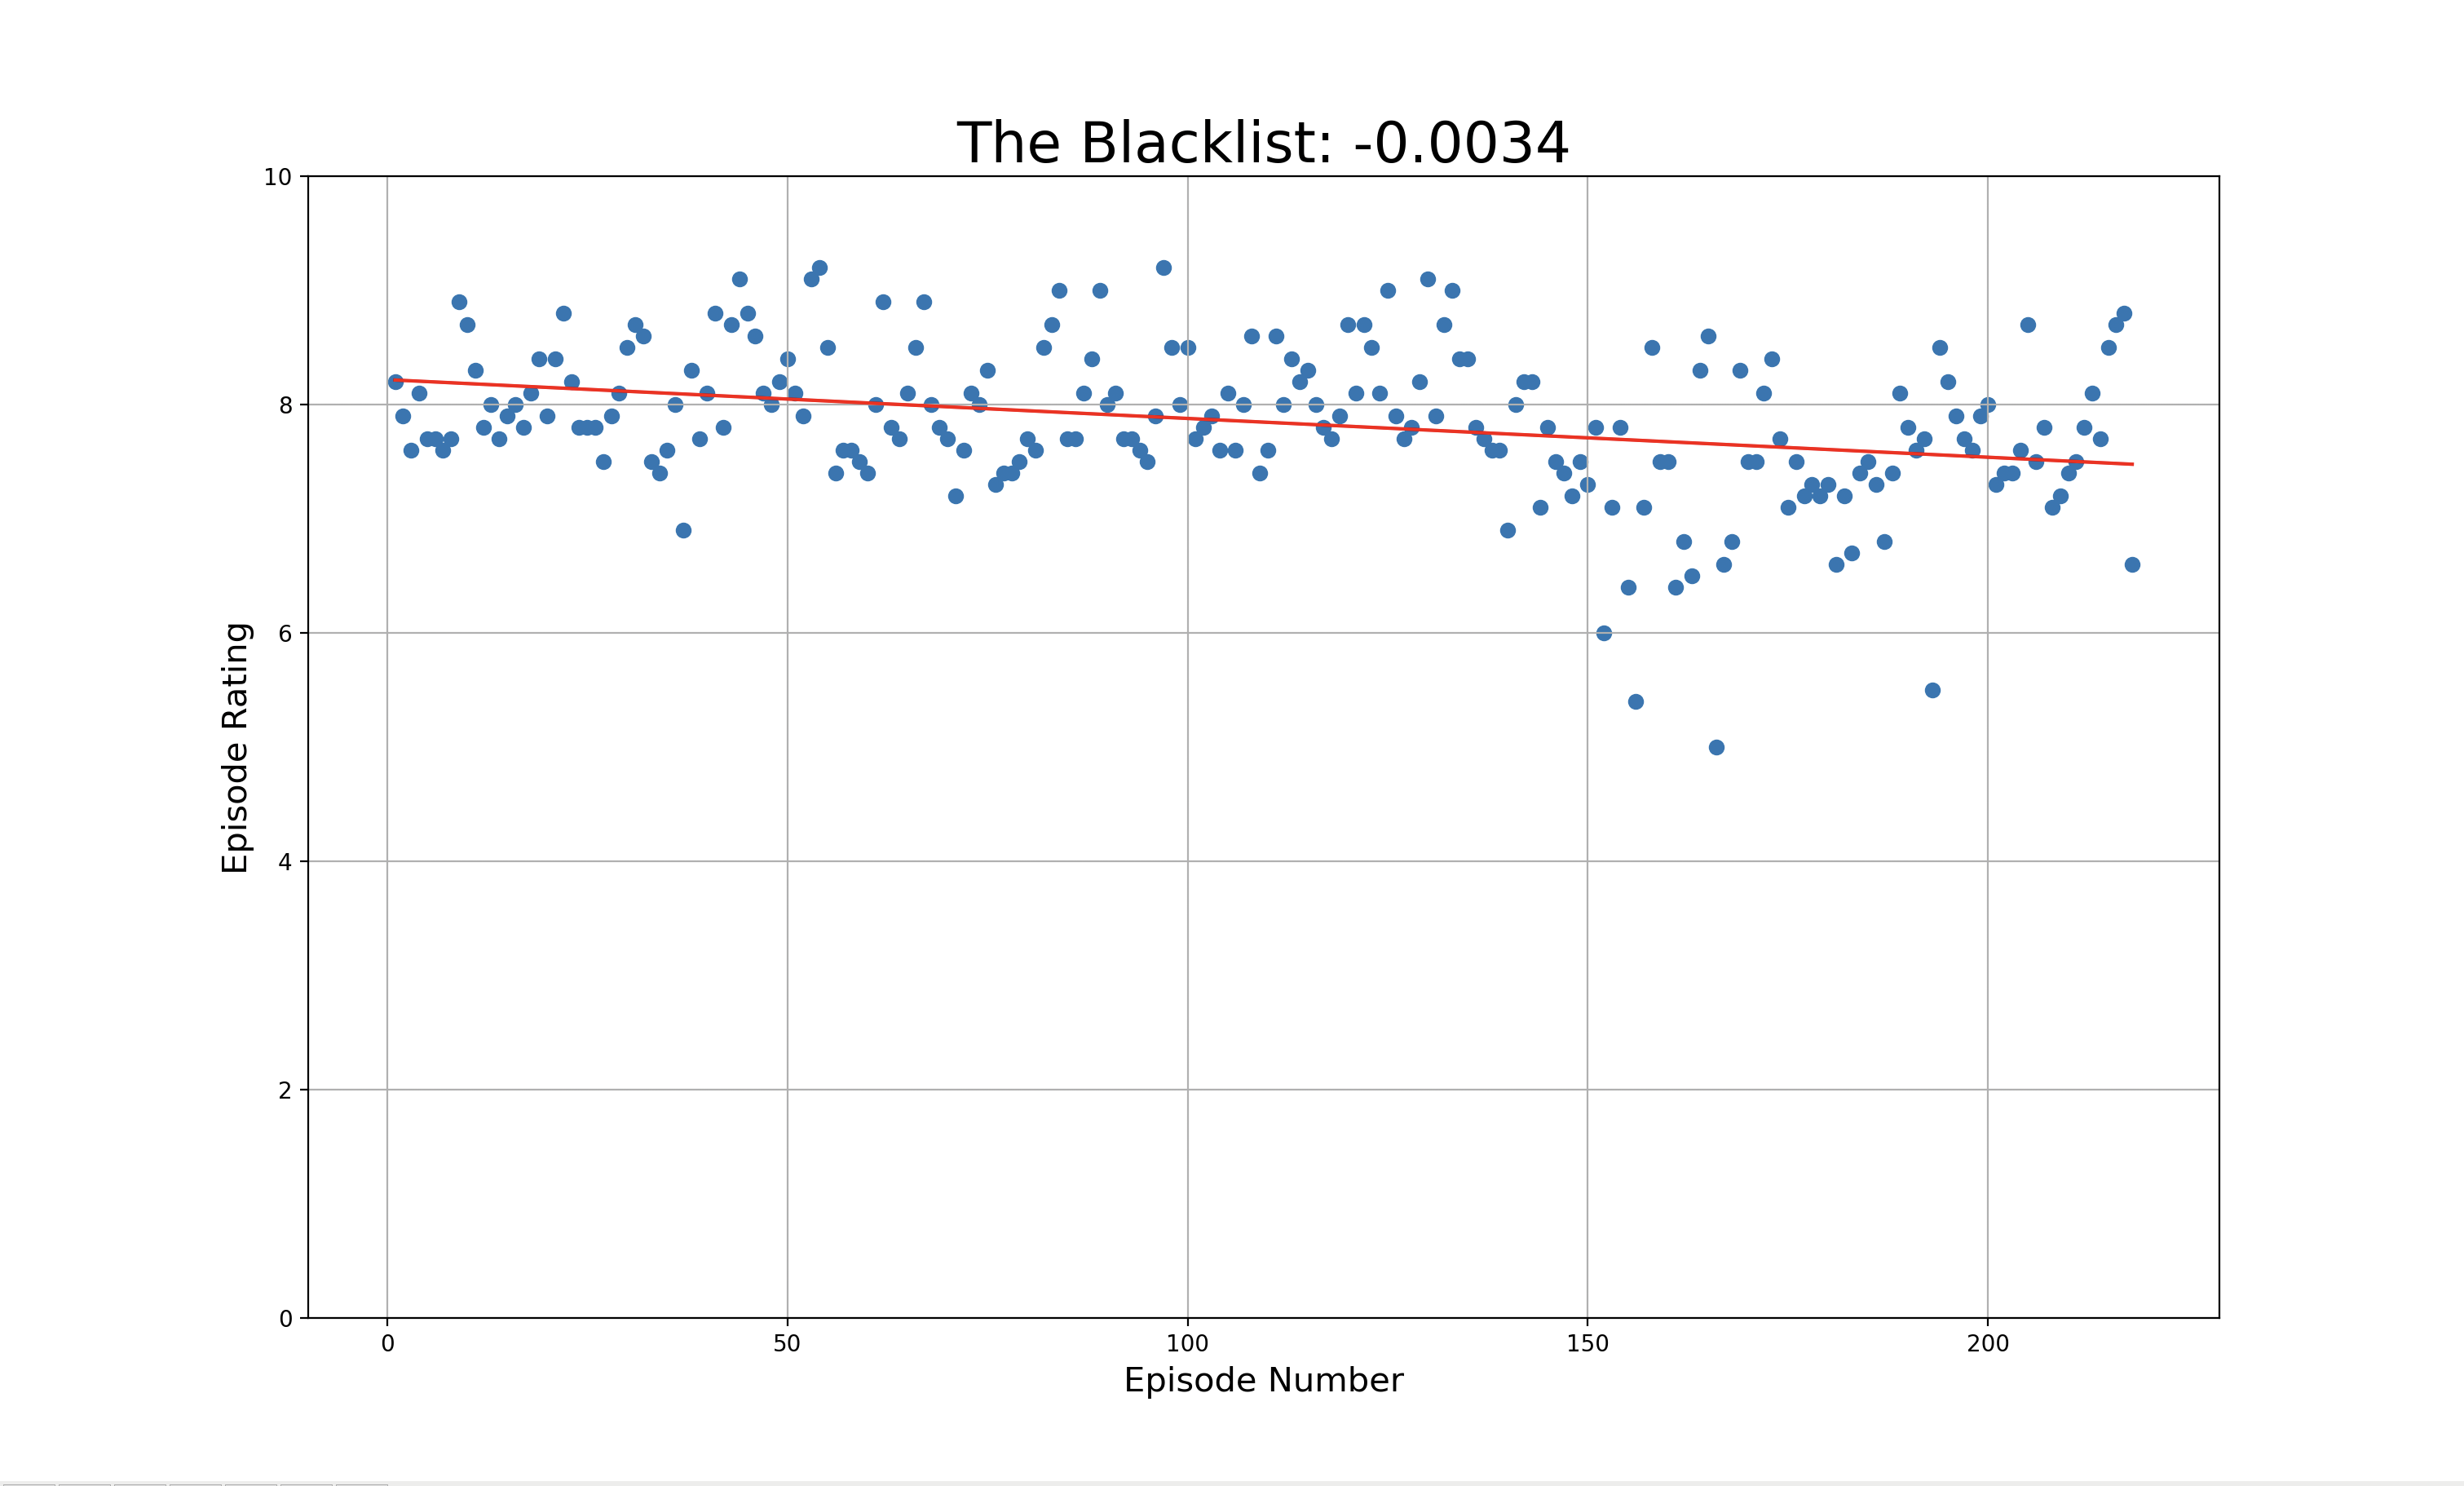
Lets take a look at The Blacklist. Its M score is \(-0.0034\). So it would seem that the consensus was correct, the show seems to slowly degrade overtime, but not by much.
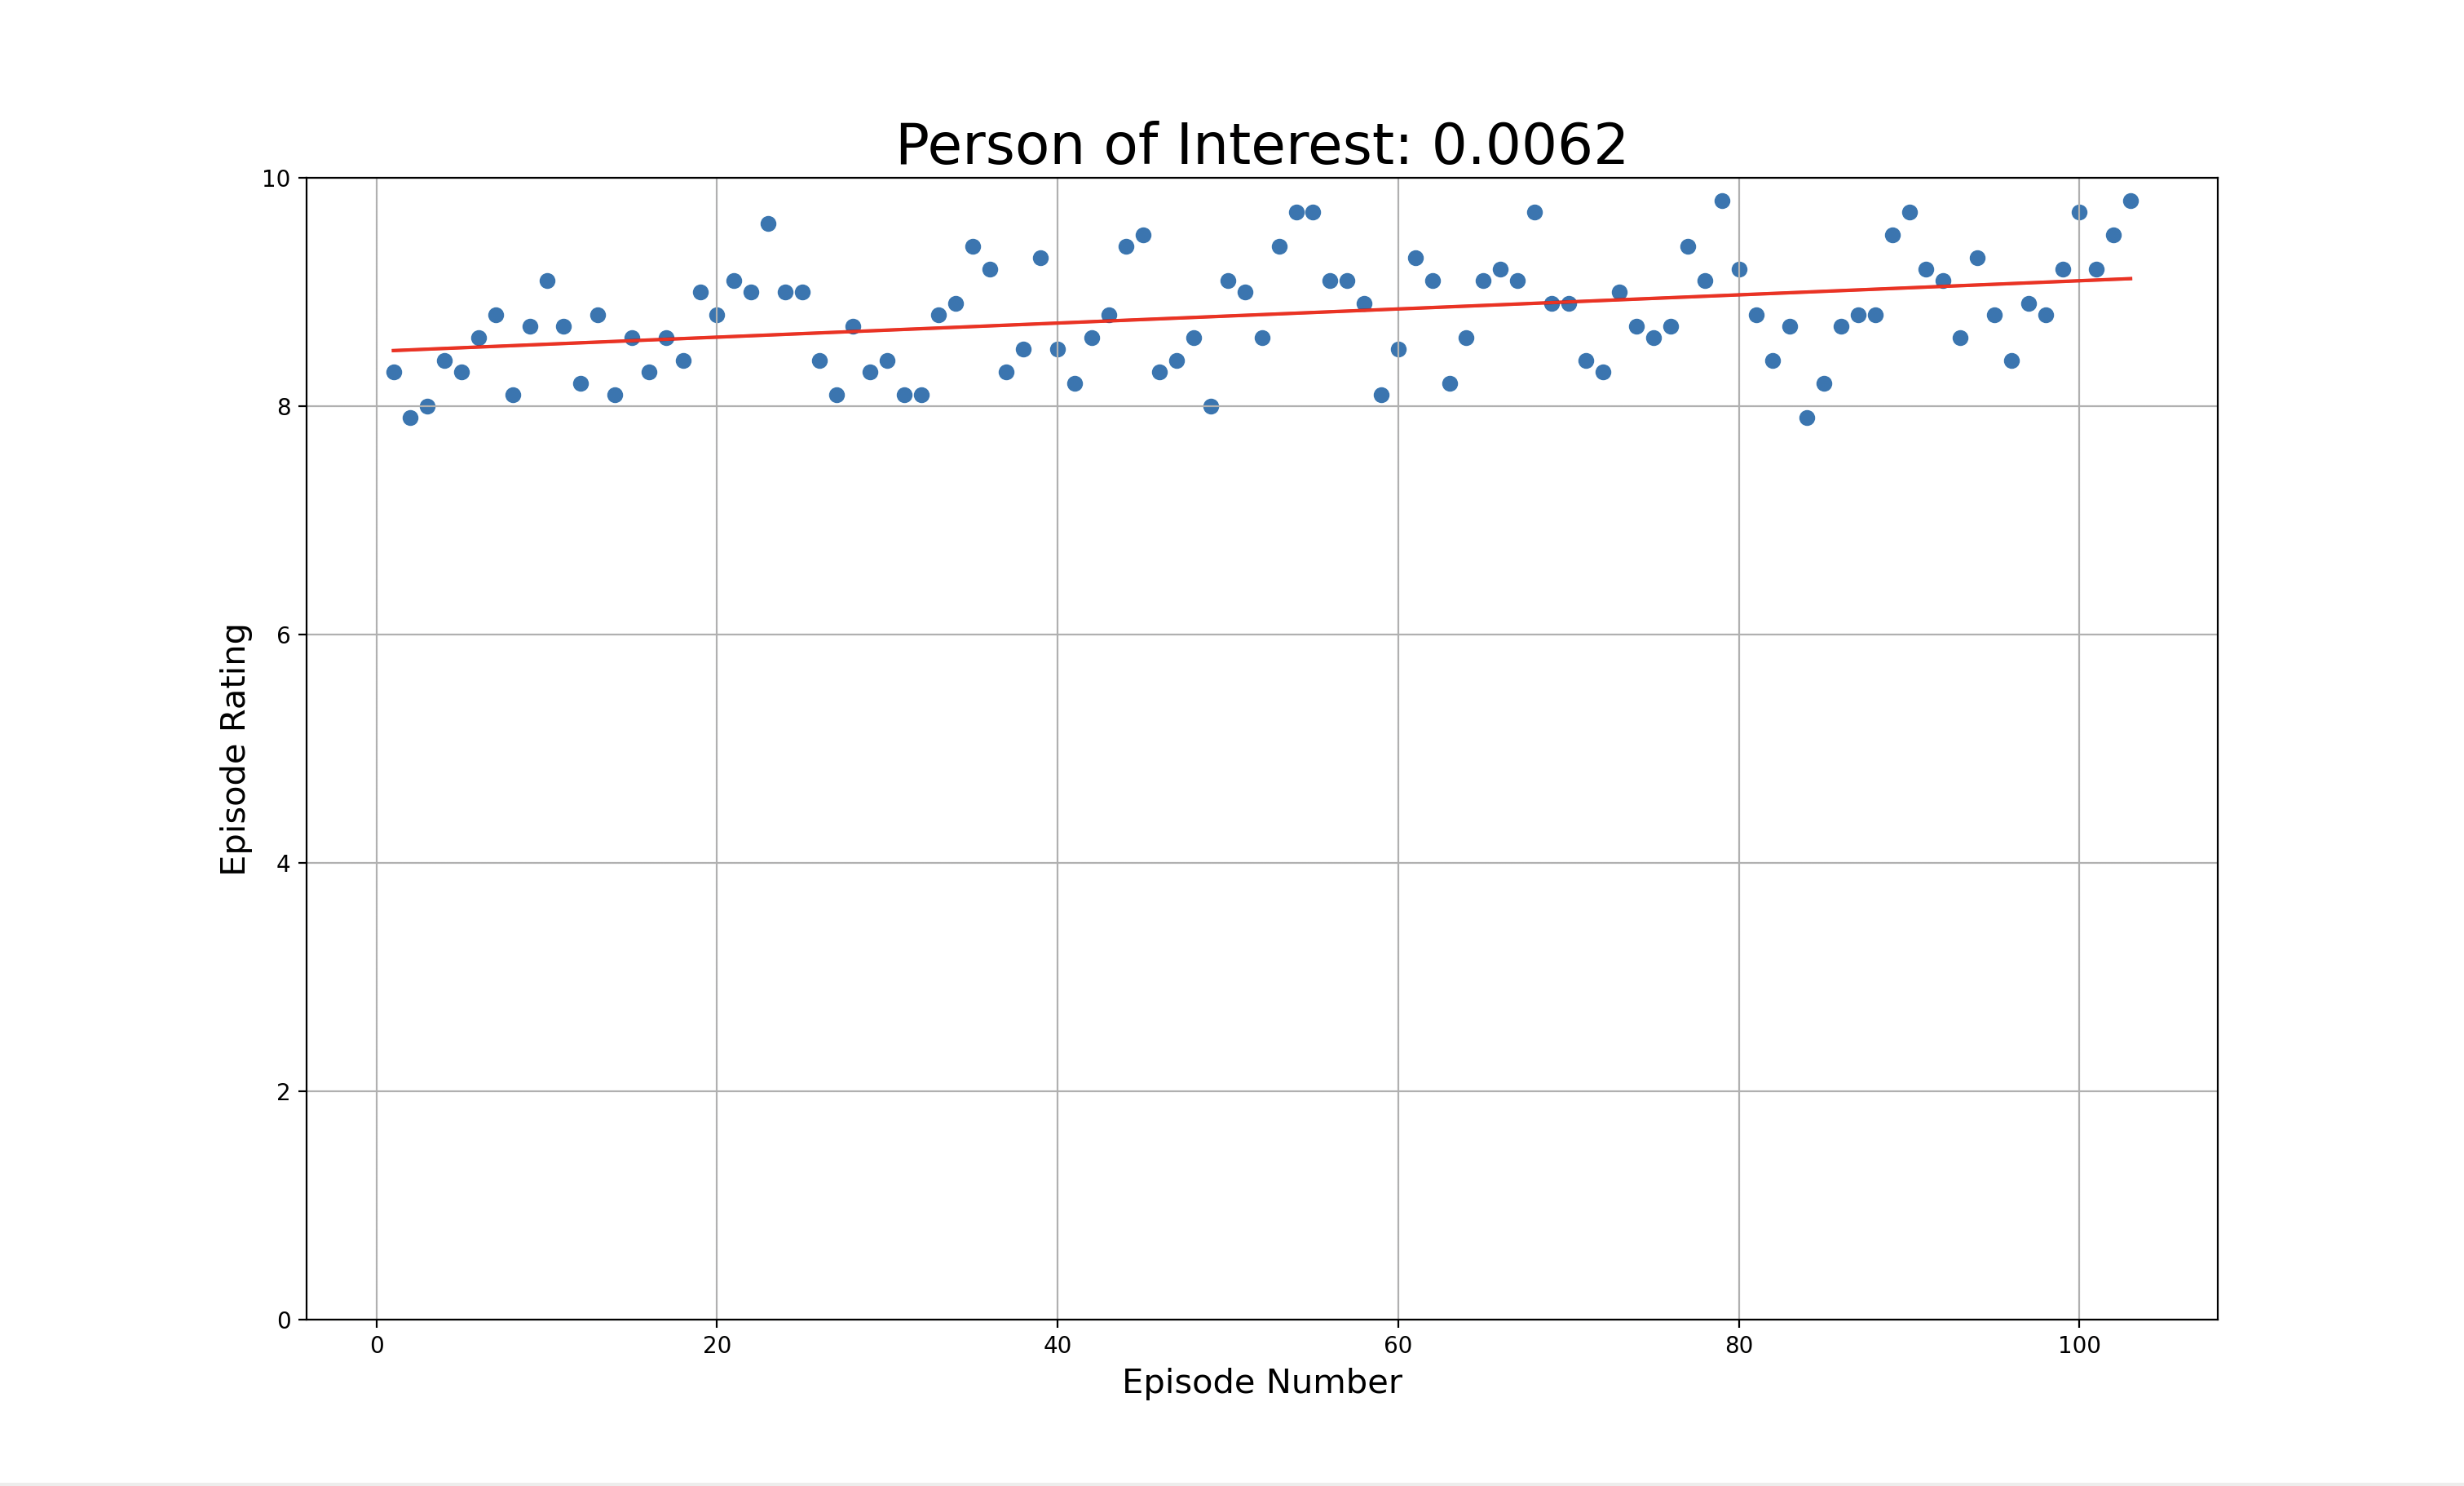
So how does Person of Interest compare? It has an M score of \(0.0062\), which is much better than The Blacklist, so again the consensus seems to match.
Exploring the Data
Next lets look at some of the outliers.
Looks like the show One Night Stand Up wins with a M Score of 8.0 and the show with the lowest M Score of -7.7 is The Playboy Morning Show
| Title | Year | M Score | Episode Count |
|---|---|---|---|
| One Night Stand Up | 2008 | 8.0 | 2 |
| Title | Year | M Score | Episode Count |
|---|---|---|---|
| The Playboy Morning Show | 2010 | -7.7 | 2 |
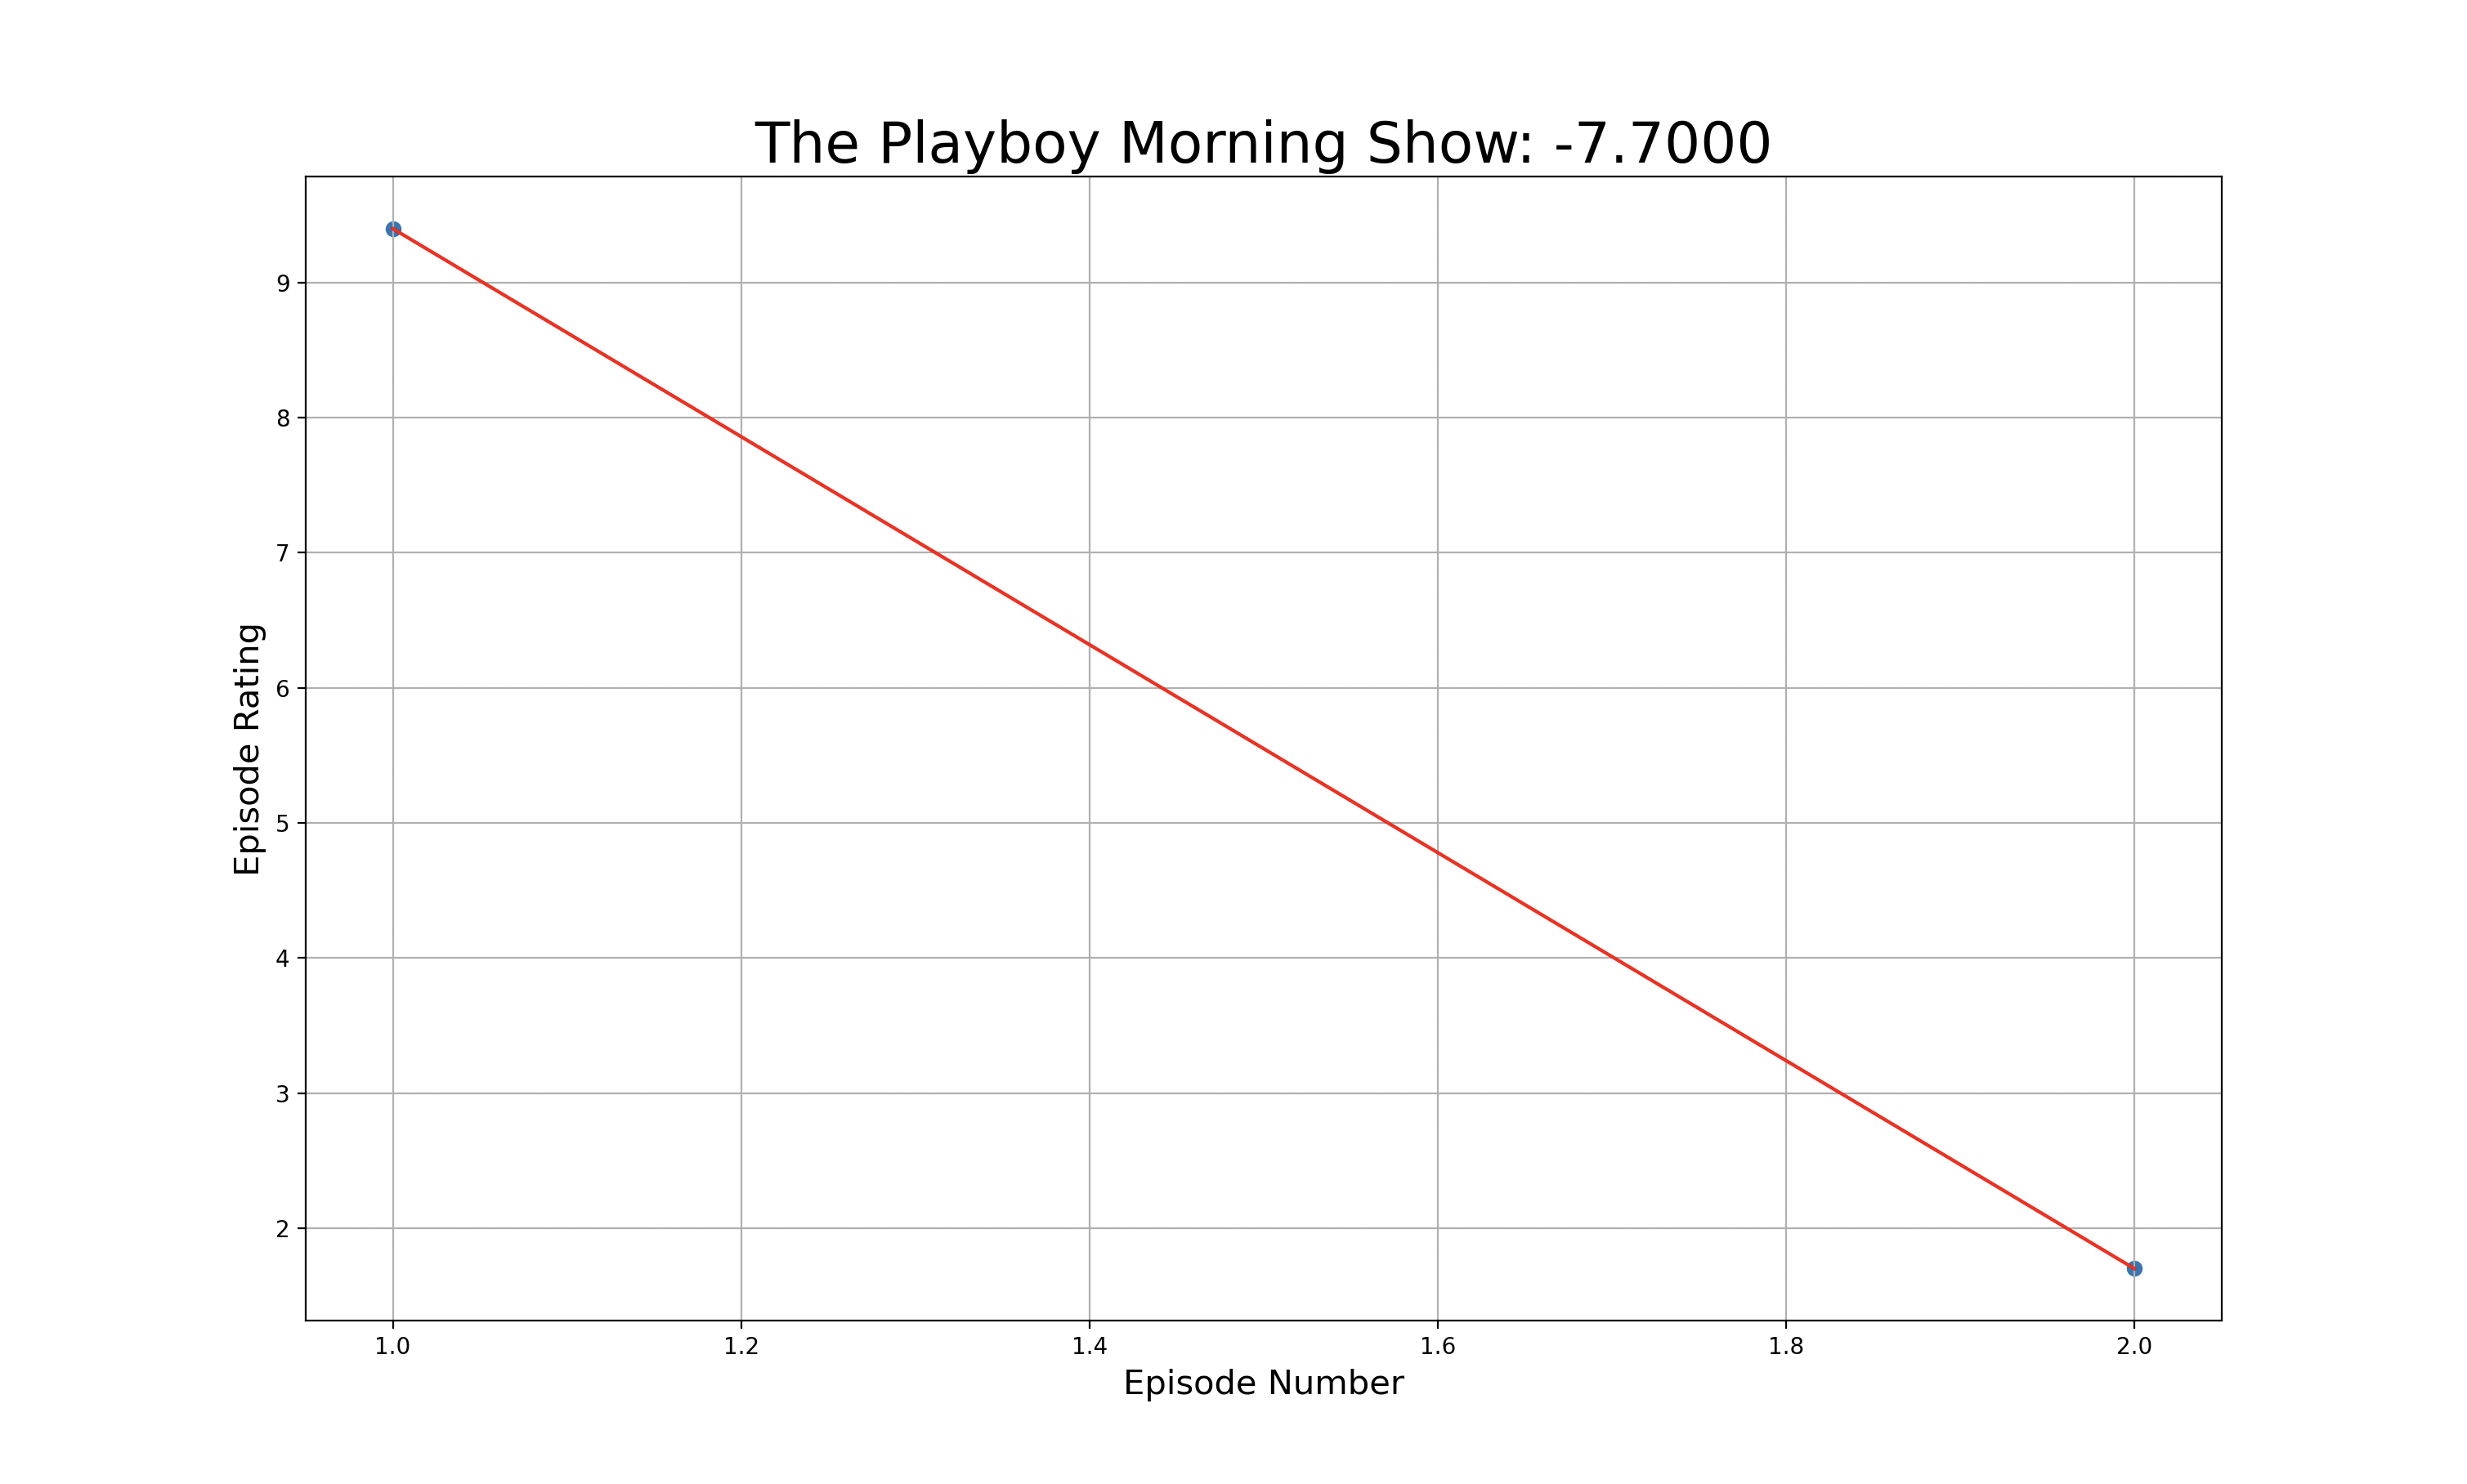
This data is not very helpful because its looking at shows that only have ratings for 2 episodes. I don’t necessary want to filter out shows with low episode counts, because there are a lot of great shows that have less than 10 episode. I do however, want to filter out shows that do not have a lot of ratings, and just look at more of the popular shows.
SELECT --select all data from our view
	slopes.tconst,
	primaryTitle,
	startYear,
	slope,
	slopes.totalVotes as totalEpisodeVotes,
	slopes.runtimeMinutes,
	title_ratings.numVotes as totalShowVotes,
	slopes.averageRating as episodeAverageRating,
	title_ratings.averageRating as tvShowRating,
	episodeCount
FROM
	slopes
	INNER JOIN title_ratings on slopes.tconst = title_ratings.tconst
AND slopes.totalVotes > 50000 -- include shows with total episode ratings count > 50,000
AND title_ratings.numVotes > 50000 -- include shows with total title ratings > 50,000
ORDER by slope desc
Our new winners become King the Land with a high M Score of 0.3560294117647058, and The Witcher with a low of -0.1436086956521739. The show that came closest to have an M score of 0 was NCIS, with a score of -0.0000054995461956.
| Title | Year | M Score | Episode Count | IMDB Rating |
|---|---|---|---|---|
| King the Land | 2023 | 0.35602.. | 16 | 5 |
| Title | Year | M Score | Episode Count | IMDB Rating |
|---|---|---|---|---|
| The Witcher | 2019 | -0.14360.. | 24 | 8 |
| Title | Year | M Score | Episode Count | IMDB Rating |
|---|---|---|---|---|
| NCIS | 2003 | -0.00000549 | 461 | 7.8 |
Here are some more graphs to look at.
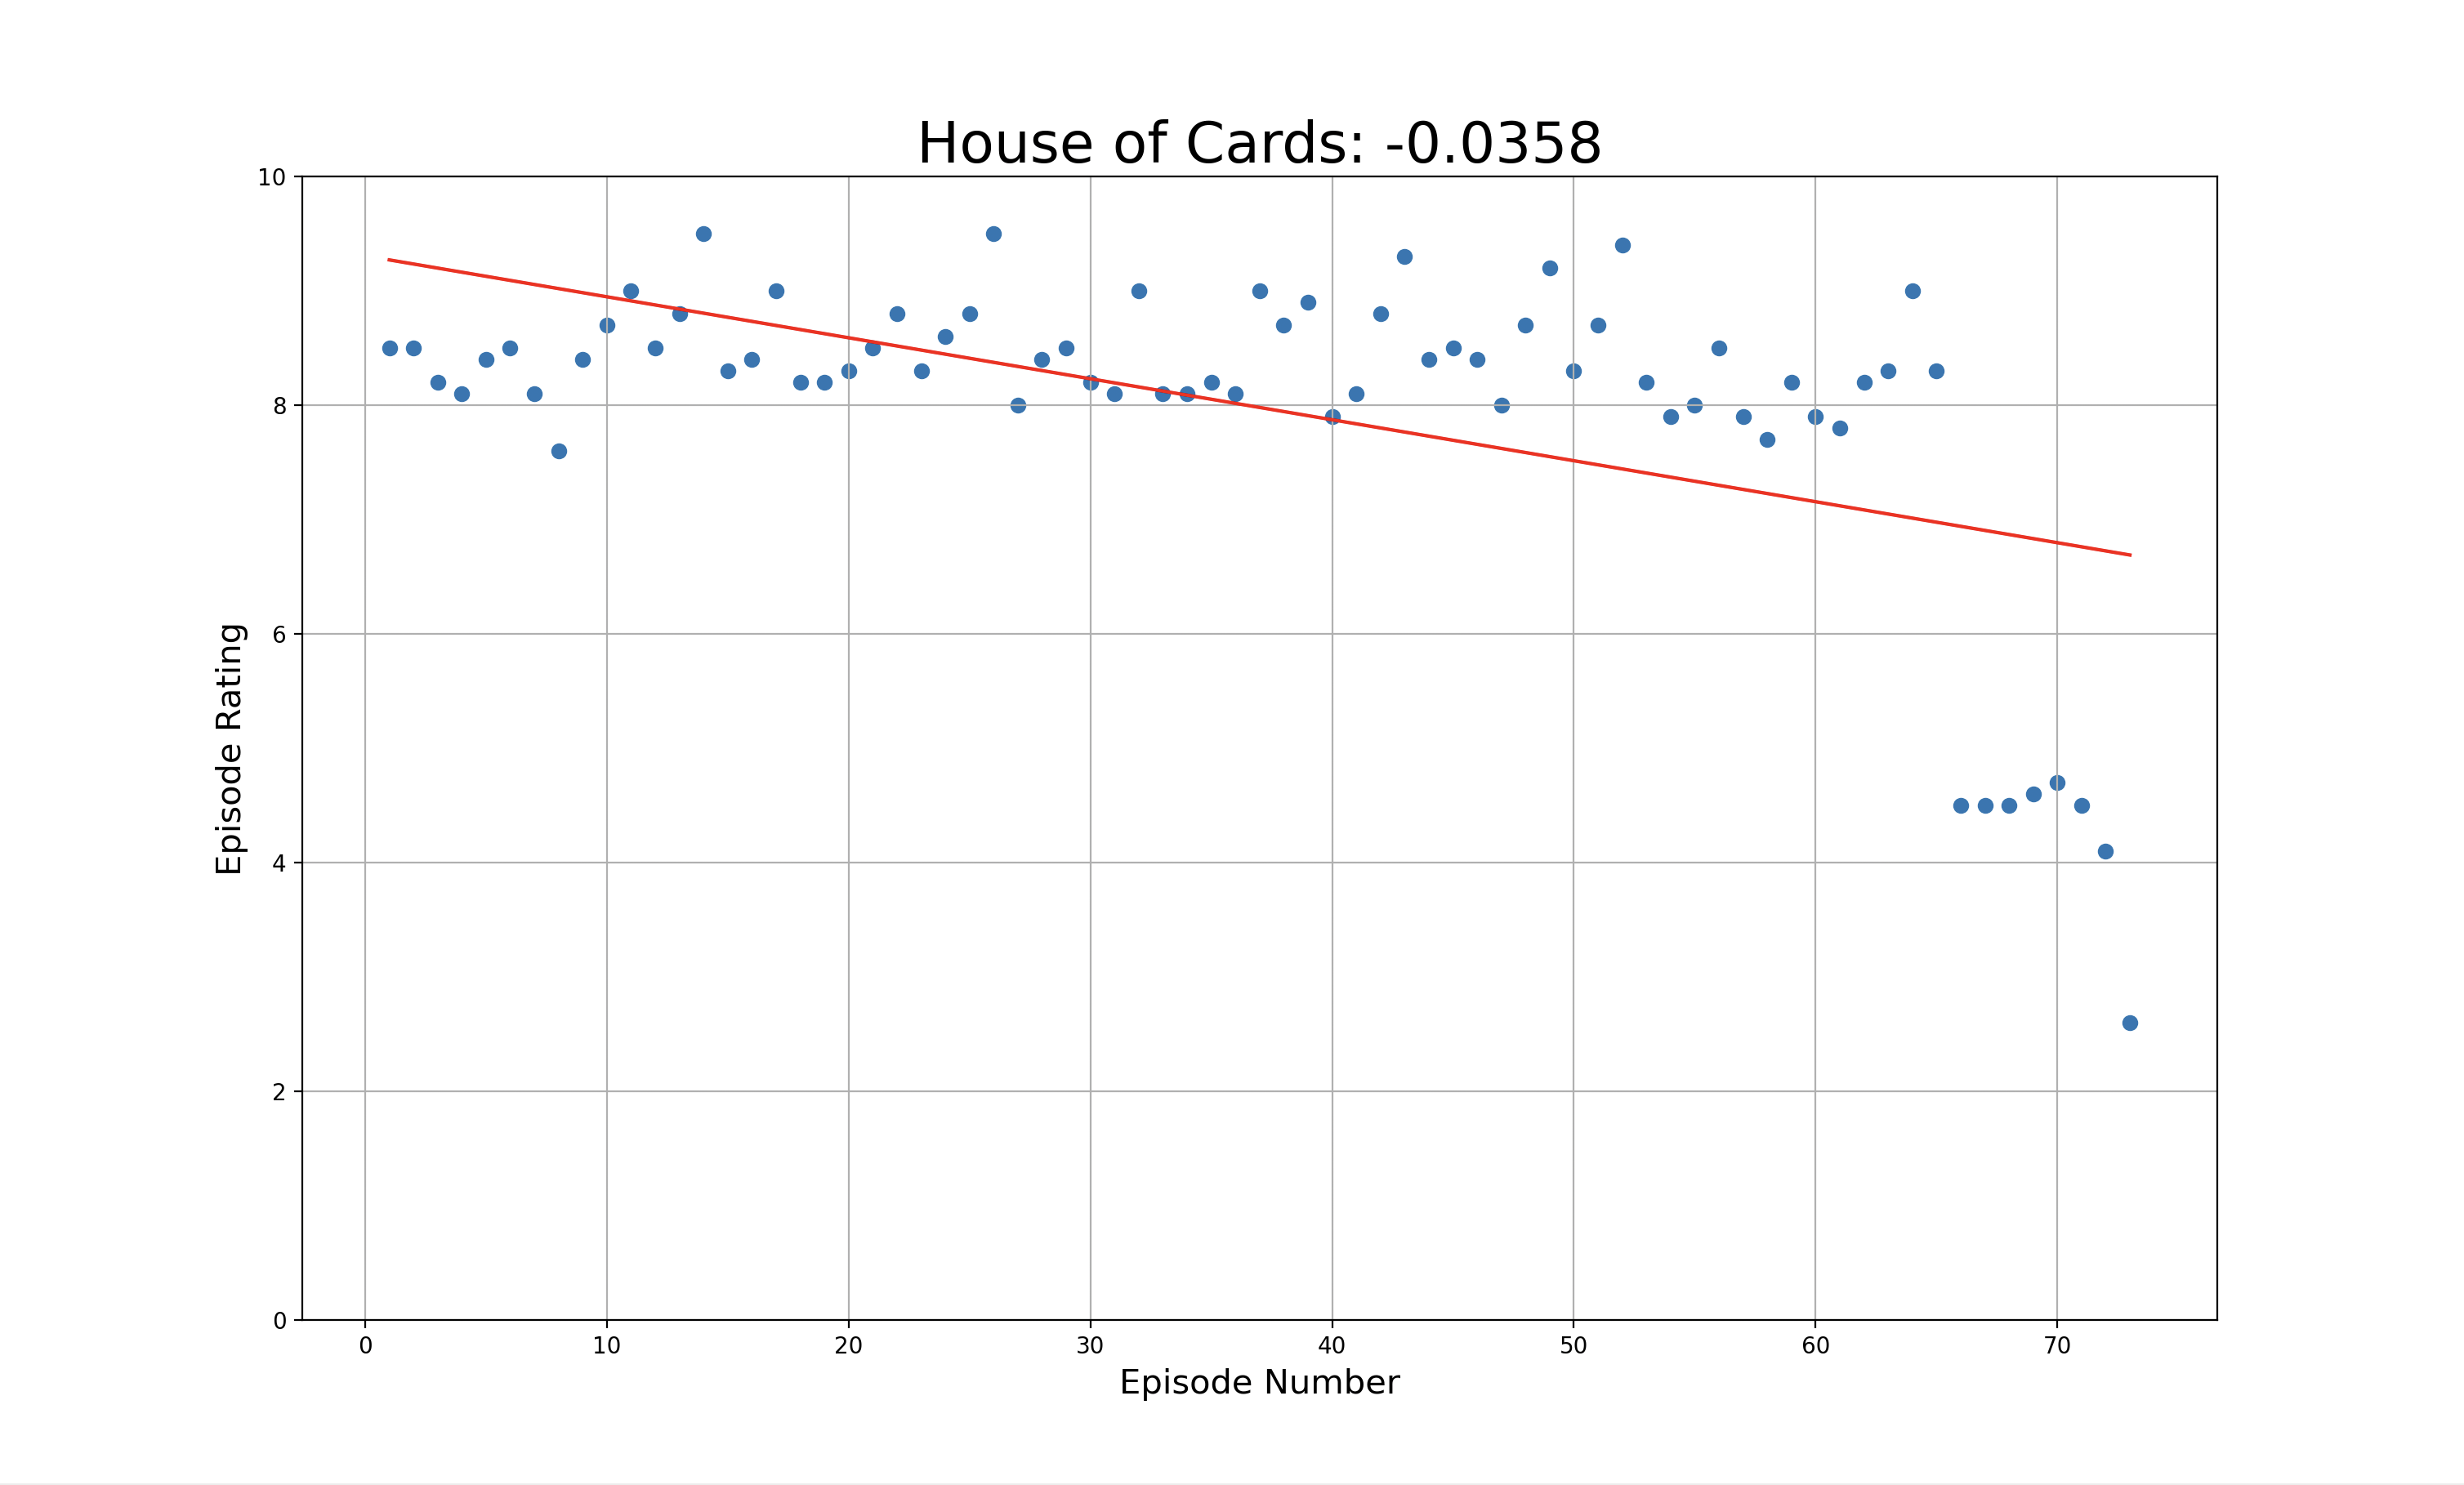
That last season really did not do well.
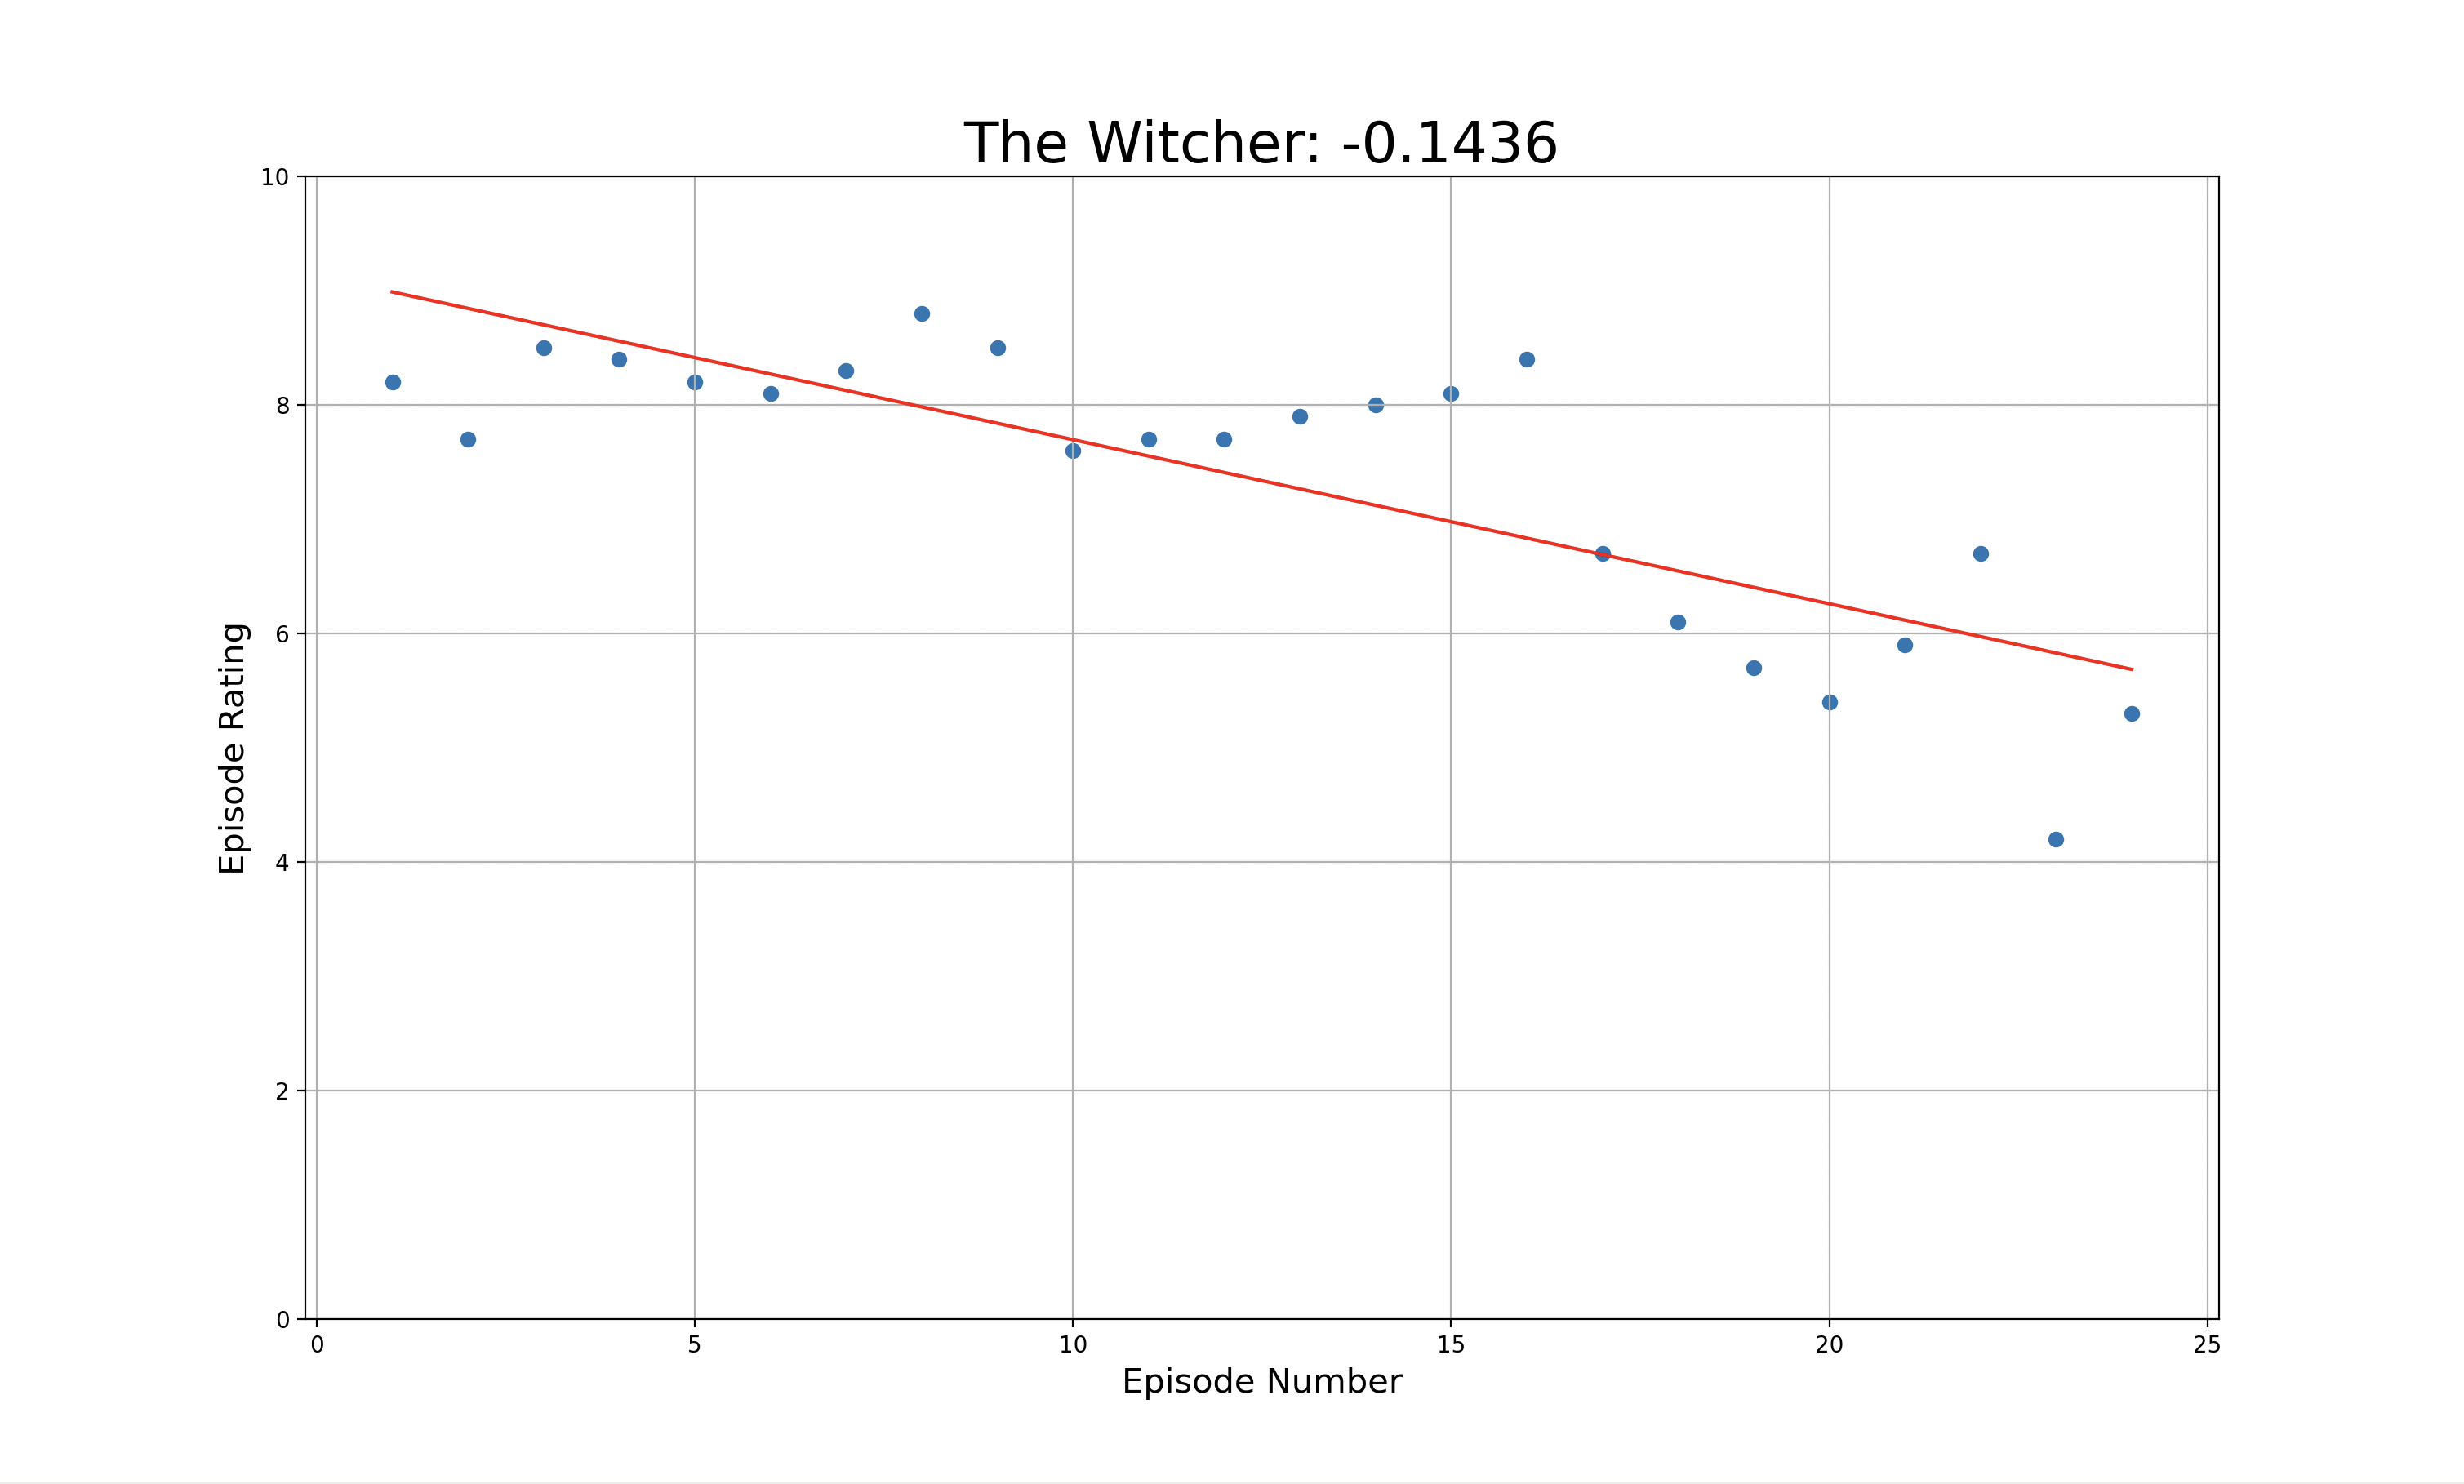
I really wanted this to be good. I loved the first season.
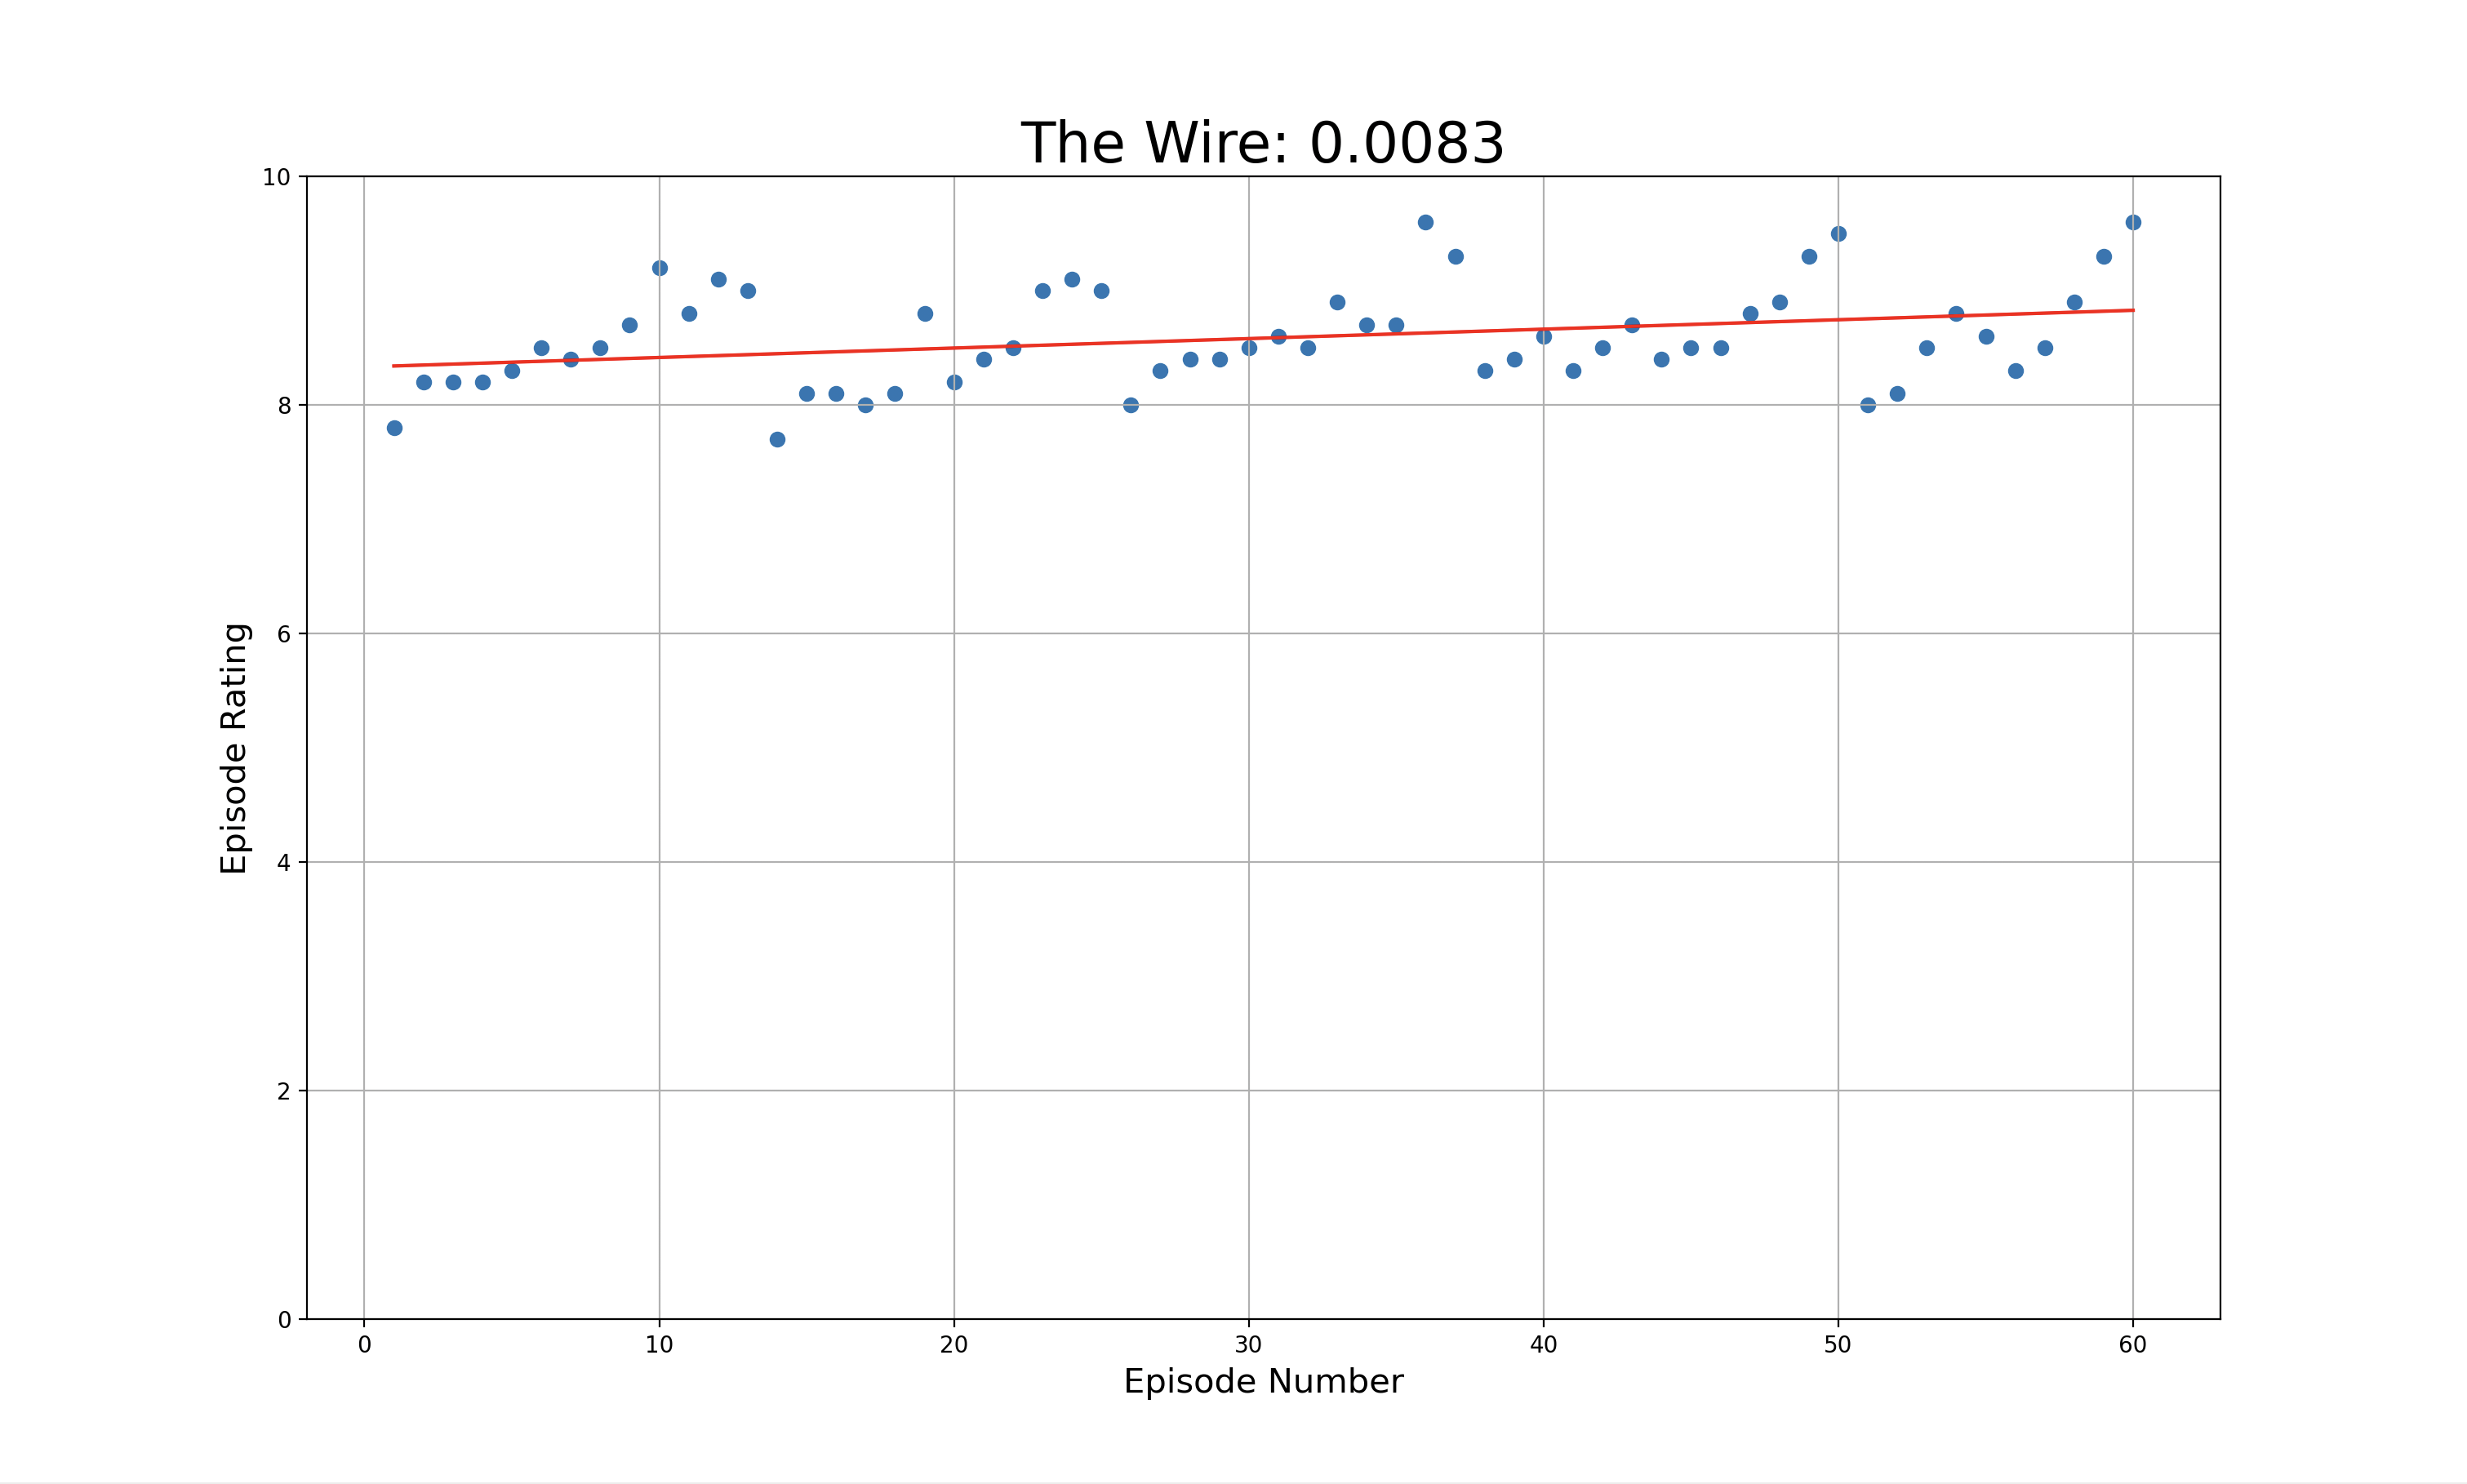
Have not seen this yet, but seems like I should.
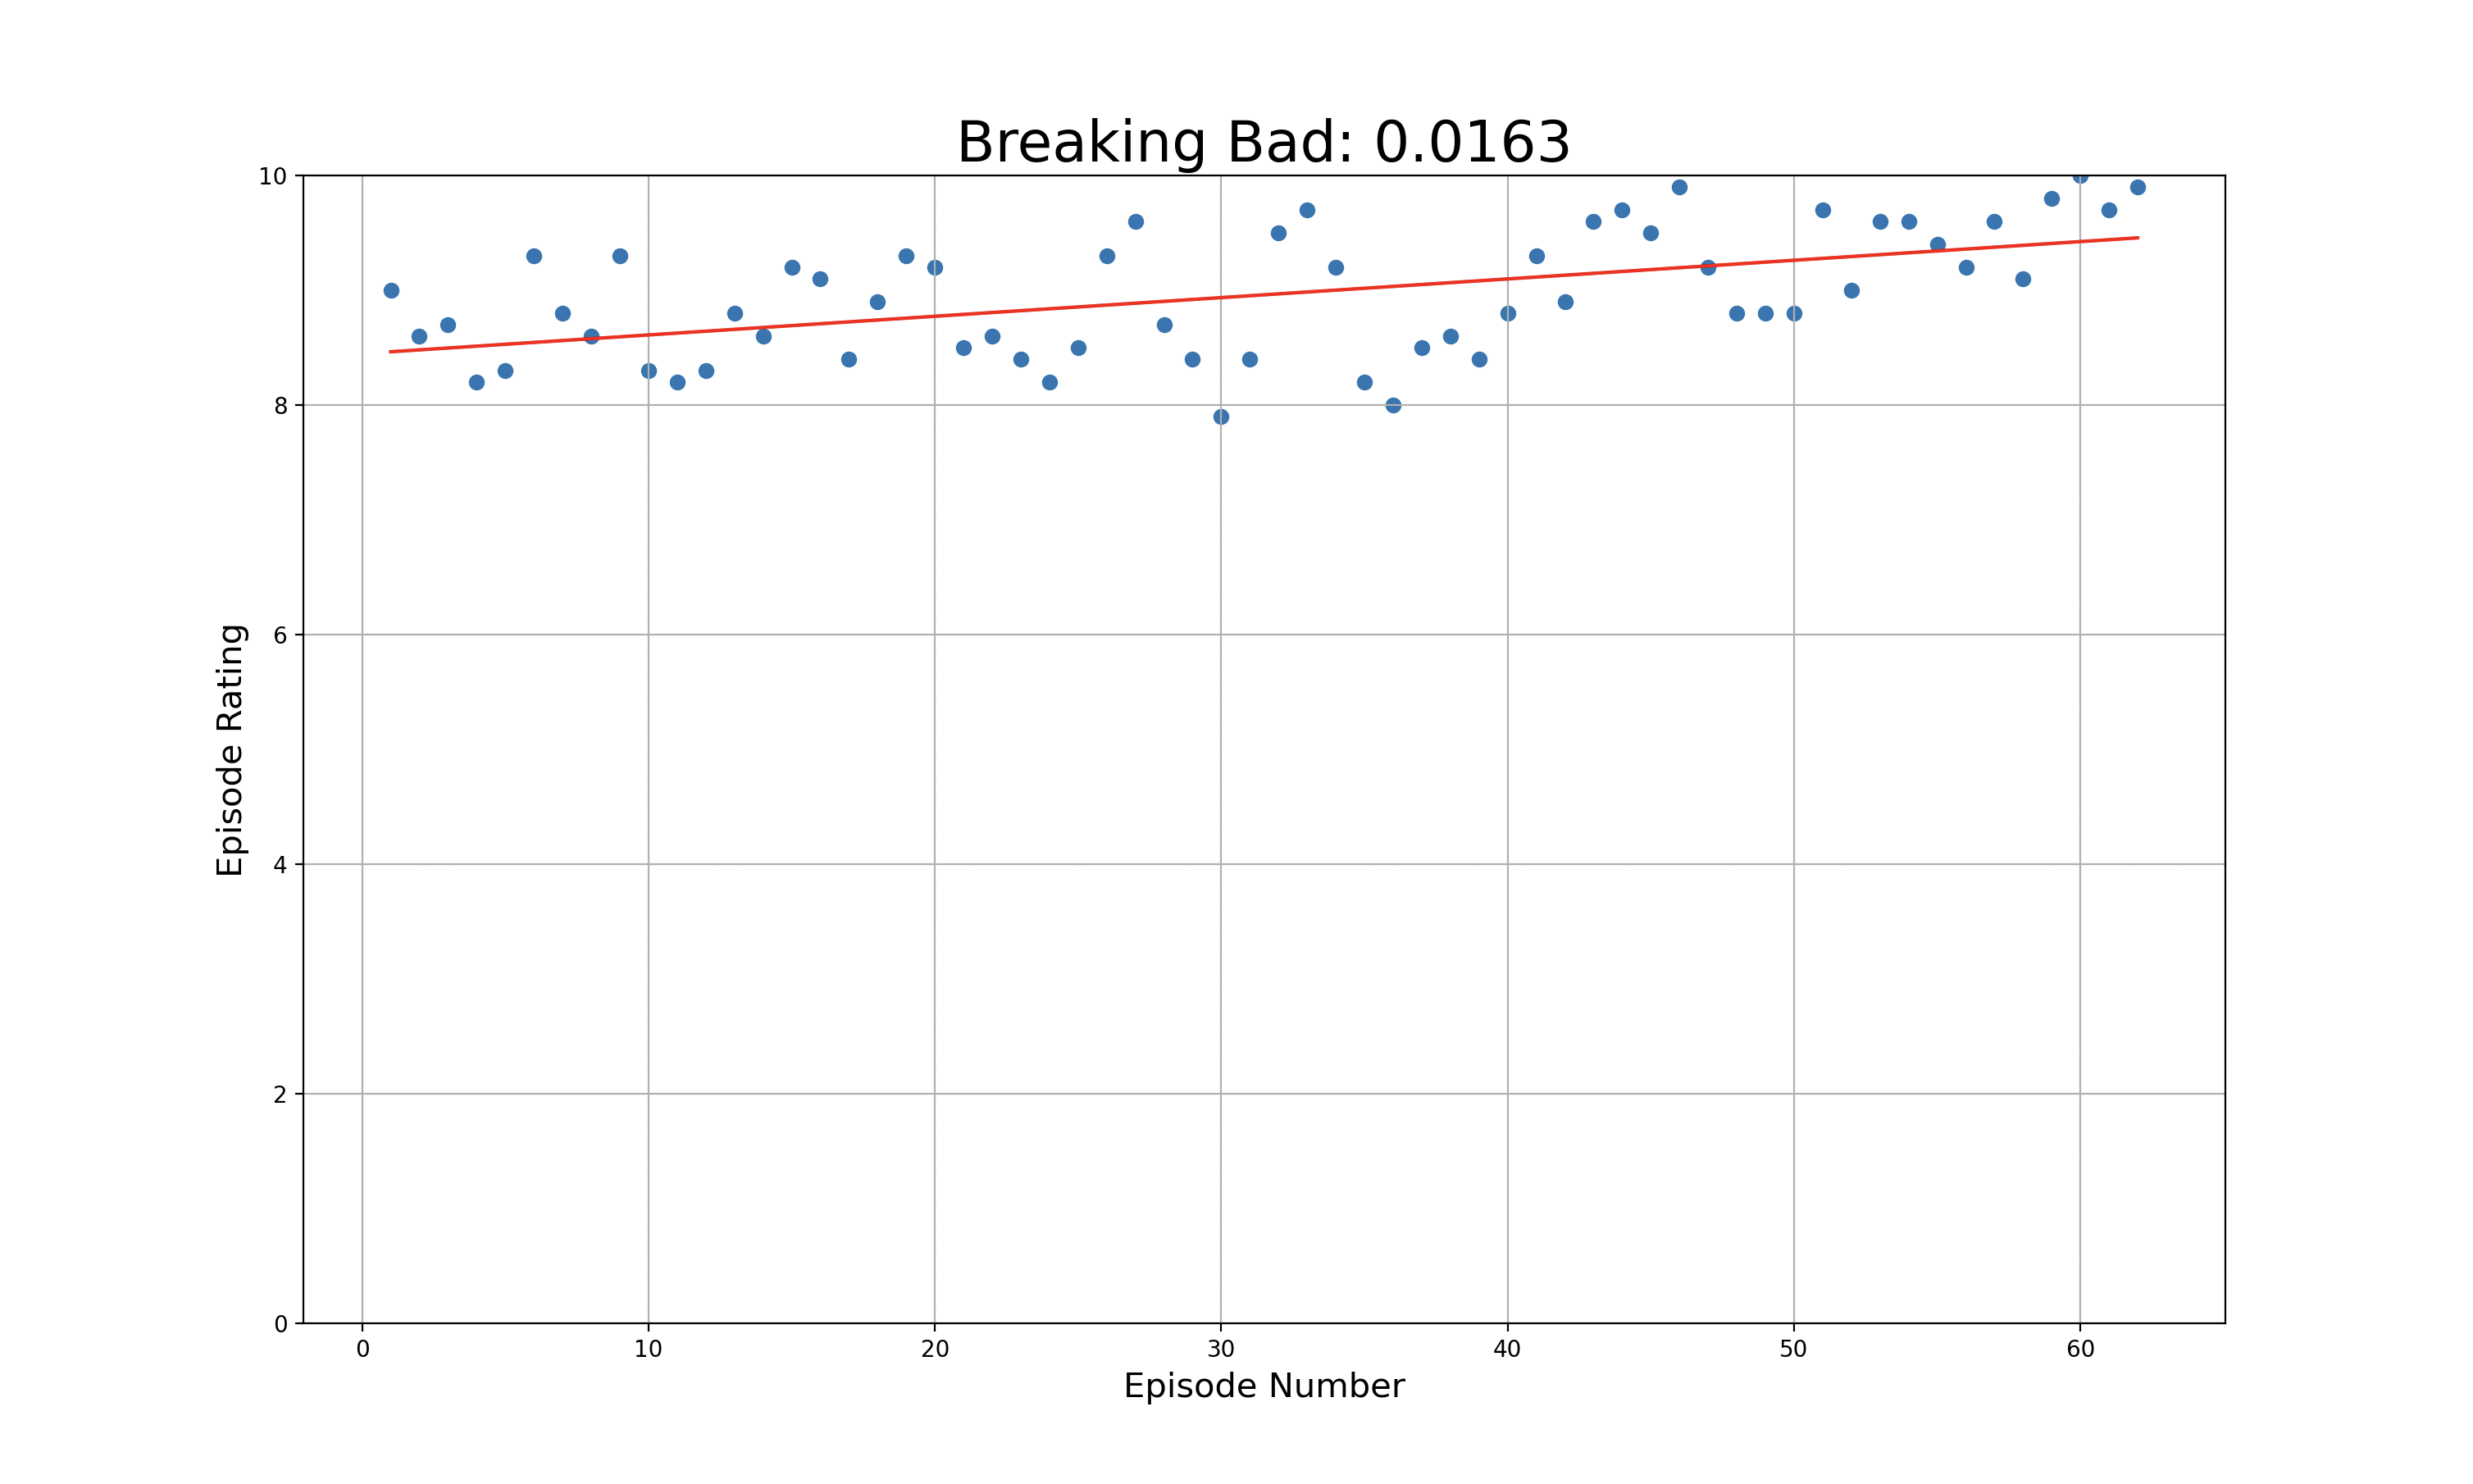
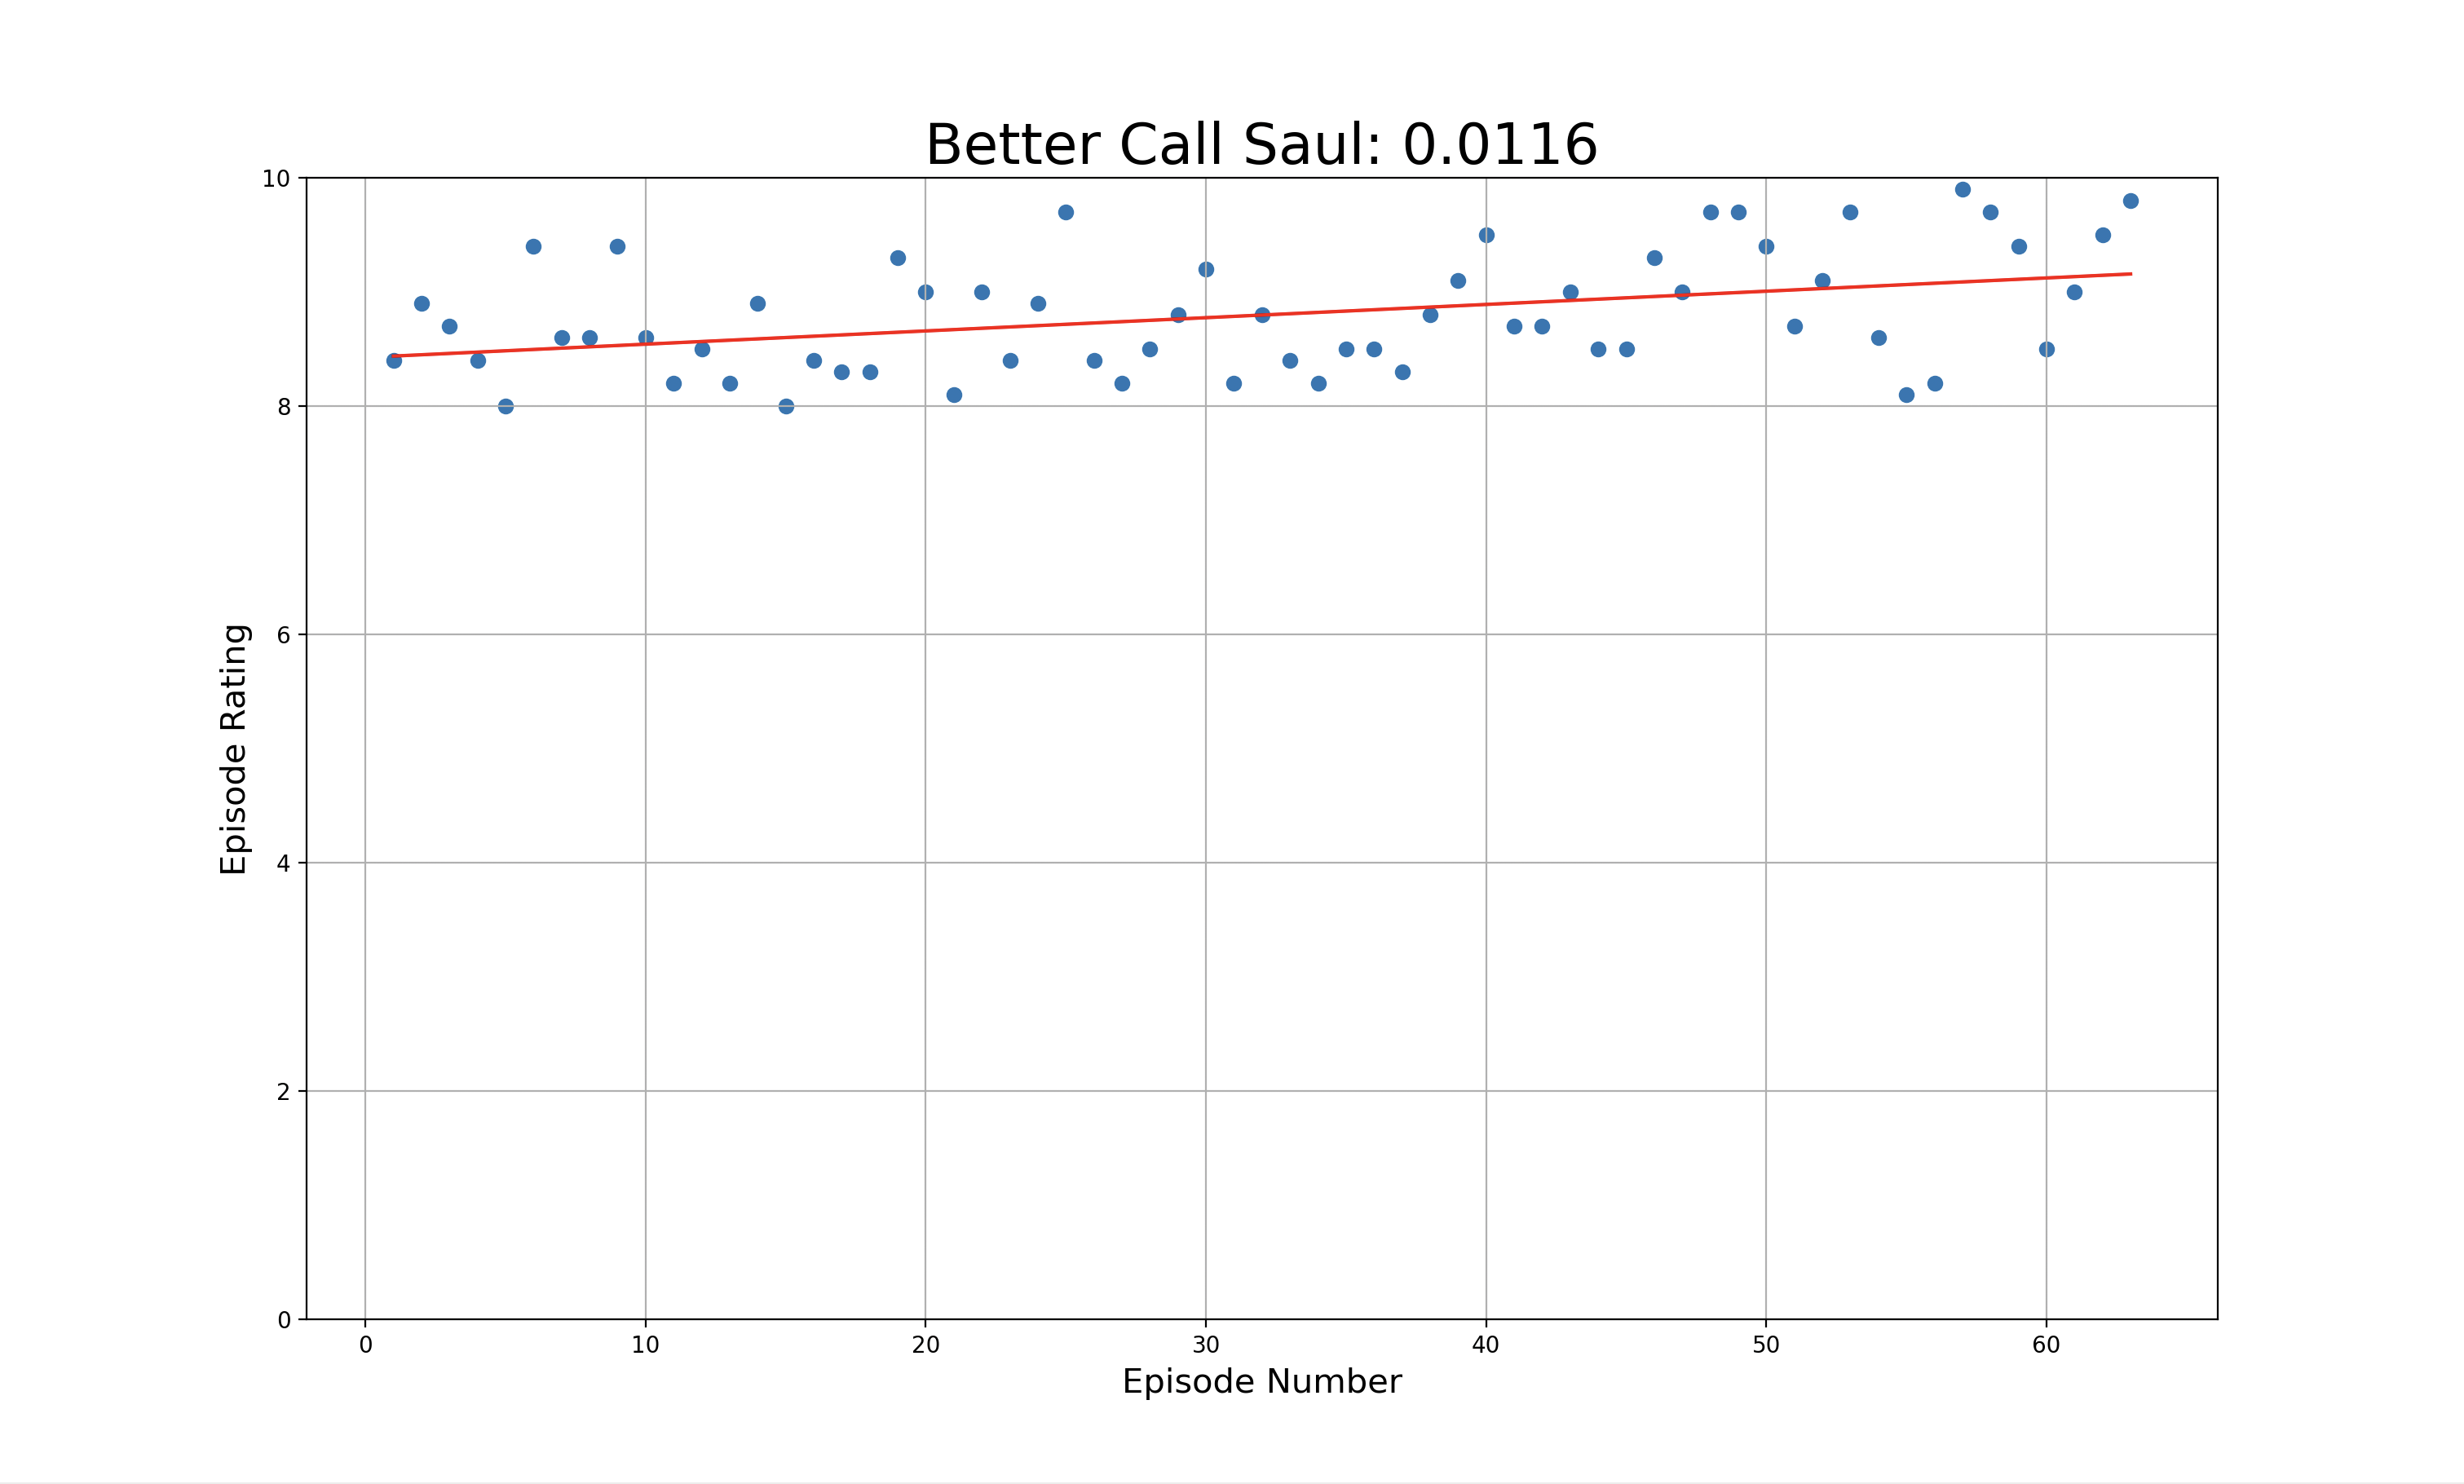
Can confirm. I loved these shows.
Conclusion
Here are the top 100 shows with the highest and lowest M Score.
| Position | Title | Year | M Score | IMDB | Episode Count |
|---|---|---|---|---|---|
| 1 | King the Land | 2023 | 0.35603 | 5.0 | 16 |
| 2 | Severance | 2022 | 0.18333 | 8.7 | 9 |
| 3 | Fleabag | 2016 | 0.14056 | 8.7 | 12 |
| 4 | Andor | 2022 | 0.13671 | 8.4 | 12 |
| 5 | Peacemaker | 2022 | 0.13571 | 8.3 | 8 |
| 6 | One Piece | 2023 | 0.10833 | 8.3 | 8 |
| 7 | Arcane | 2021 | 0.10333 | 9.0 | 9 |
| 8 | Warrior Nun | 2020 | 0.08596 | 7.0 | 18 |
| 9 | The White Lotus | 2021 | 0.08462 | 8.0 | 13 |
| 10 | The Bear | 2022 | 0.08462 | 8.6 | 18 |
| 11 | The Office | 2001 | 0.07956 | 8.5 | 14 |
| 12 | Silo | 2023 | 0.07636 | 8.1 | 10 |
| 13 | Kingdom | 2019 | 0.07168 | 8.3 | 12 |
| 14 | The Wheel of Time | 2021 | 0.07074 | 7.2 | 16 |
| 15 | House of the Dragon | 2022 | 0.0703 | 8.4 | 10 |
| 16 | Foundation | 2021 | 0.06684 | 7.6 | 20 |
| 17 | Wednesday | 2022 | 0.05714 | 8.1 | 8 |
| 18 | The Family Man | 2019 | 0.05649 | 8.7 | 19 |
| 19 | Star Trek: Picard | 2020 | 0.04841 | 7.5 | 30 |
| 20 | The Leftovers | 2014 | 0.0433 | 8.3 | 28 |
| 21 | Ahsoka | 2023 | 0.04286 | 7.6 | 8 |
| 22 | Sense8 | 2015 | 0.0413 | 8.2 | 24 |
| 23 | Neon Genesis Evangelion | 1995 | 0.0374 | 8.5 | 26 |
| 24 | Twin Peaks | 2017 | 0.03437 | 8.5 | 18 |
| 25 | Dark | 2017 | 0.03405 | 8.7 | 26 |
| 26 | Gravity Falls | 2012 | 0.03348 | 8.9 | 41 |
| 27 | Succession | 2018 | 0.03241 | 8.8 | 39 |
| 28 | Castlevania | 2017 | 0.03156 | 8.3 | 32 |
| 29 | Euphoria | 2019 | 0.03147 | 8.3 | 16 |
| 30 | Cowboy Bebop | 1998 | 0.02964 | 8.9 | 26 |
| 31 | Rome | 2005 | 0.02964 | 8.7 | 22 |
| 32 | The End of the F***ing World | 2017 | 0.02824 | 8.0 | 16 |
| 33 | Halo | 2022 | 0.02681 | 7.2 | 14 |
| 34 | Jujutsu Kaisen | 2020 | 0.02662 | 8.6 | 47 |
| 35 | Code Geass | 2006 | 0.02631 | 8.7 | 50 |
| 36 | Loki | 2021 | 0.02448 | 8.2 | 12 |
| 37 | The Lord of the Rings: The Rings of Power | 2022 | 0.02262 | 7.0 | 8 |
| 38 | Black Sails | 2014 | 0.02184 | 8.2 | 38 |
| 39 | Big Little Lies | 2017 | 0.02176 | 8.4 | 14 |
| 40 | Spartacus | 2010 | 0.02099 | 8.5 | 33 |
| 41 | Mr. Robot | 2015 | 0.02066 | 8.5 | 45 |
| 42 | The Orville | 2017 | 0.02008 | 8.0 | 36 |
| 43 | Mindhunter | 2017 | 0.01982 | 8.6 | 19 |
| 44 | Avatar: The Last Airbender | 2005 | 0.01925 | 9.3 | 62 |
| 45 | Anne with an E | 2017 | 0.0185 | 8.6 | 27 |
| 46 | Bates Motel | 2013 | 0.01818 | 8.1 | 50 |
| 47 | The Killing | 2011 | 0.01784 | 8.3 | 44 |
| 48 | Banshee | 2013 | 0.01757 | 8.4 | 38 |
| 49 | Fullmetal Alchemist: Brotherhood | 2009 | 0.01744 | 9.1 | 64 |
| 50 | Barry | 2018 | 0.01705 | 8.4 | 32 |
| … | |||||
| 150 | NCIS | 2003 | -0.00001 | 7.8 | 461 |
| … | |||||
| 275 | The Last of Us | 2023 | -0.01333 | 8.7 | 9 |
| 276 | Luther | 2010 | -0.01414 | 8.4 | 20 |
| 277 | You | 2018 | -0.01487 | 7.7 | 40 |
| 278 | His Dark Materials | 2019 | -0.01492 | 7.8 | 23 |
| 279 | She Hulk: Attorney at Law | 2022 | -0.015 | 5.3 | 9 |
| 280 | American Horror Story | 2011 | -0.01547 | 8.0 | 128 |
| 281 | Jessica Jones | 2015 | -0.01563 | 7.9 | 39 |
| 282 | Narcos: Mexico | 2018 | -0.0158 | 8.4 | 30 |
| 283 | Riverdale | 2017 | -0.01617 | 6.5 | 137 |
| 284 | Heroes | 2006 | -0.01632 | 7.5 | 80 |
| 285 | Luke Cage | 2016 | -0.01651 | 7.2 | 26 |
| 286 | Arrested Development | 2003 | -0.01663 | 8.7 | 84 |
| 287 | Fear the Walking Dead | 2015 | -0.01669 | 6.8 | 113 |
| 288 | See | 2019 | -0.0167 | 7.6 | 24 |
| 289 | Billions | 2016 | -0.01703 | 8.3 | 84 |
| 290 | Money Heist | 2017 | -0.01955 | 8.2 | 41 |
| 291 | Rick and Morty | 2013 | -0.01964 | 9.1 | 71 |
| 292 | The Umbrella Academy | 2019 | -0.02129 | 7.9 | 30 |
| 293 | Squid Game | 2021 | -0.02167 | 8.0 | 9 |
| 294 | Raised by Wolves | 2020 | -0.02229 | 7.4 | 18 |
| 295 | Tom Clancy’s Jack Ryan | 2018 | -0.0226 | 8.0 | 30 |
| 296 | Fargo | 2014 | -0.02367 | 8.9 | 51 |
| 297 | American Crime Story | 2016 | -0.02384 | 8.4 | 29 |
| 298 | Death Note | 2006 | -0.02423 | 8.9 | 37 |
| 299 | One Punch Man | 2015 | -0.02492 | 8.7 | 25 |
| 300 | Chilling Adventures of Sabrina | 2018 | -0.02524 | 7.4 | 36 |
| 301 | Twin Peaks | 1990 | -0.02612 | 8.8 | 30 |
| 302 | Reacher | 2022 | -0.02706 | 8.1 | 16 |
| 303 | The Mandalorian | 2019 | -0.02748 | 8.7 | 24 |
| 304 | Sherlock | 2010 | -0.02857 | 9.1 | 15 |
| 305 | Westworld | 2016 | -0.02985 | 8.5 | 36 |
| 306 | The Morning Show | 2019 | -0.03081 | 8.2 | 30 |
| 307 | Titans | 2018 | -0.03172 | 7.5 | 49 |
| 308 | The Sandman | 2022 | -0.03182 | 7.7 | 11 |
| 309 | Dhindora | 2021 | -0.03333 | 8.8 | 8 |
| 310 | The Sinner | 2017 | -0.03383 | 7.9 | 32 |
| 311 | Doom Patrol | 2019 | -0.03467 | 7.7 | 46 |
| 312 | House of Cards | 2013 | -0.03584 | 8.6 | 73 |
| 313 | Sex Education | 2019 | -0.03898 | 8.3 | 32 |
| 314 | Star Trek: Discovery | 2017 | -0.04022 | 7.1 | 55 |
| 315 | Good Omens | 2019 | -0.04091 | 8.0 | 12 |
| 316 | Elite | 2018 | -0.04591 | 7.2 | 56 |
| 317 | 13 Reasons Why | 2017 | -0.04865 | 7.5 | 49 |
| 318 | Black Mirror | 2011 | -0.05983 | 8.7 | 27 |
| 319 | Killing Eve | 2018 | -0.07429 | 8.1 | 32 |
| 320 | The Animatrix | 2003 | -0.08333 | 7.3 | 9 |
| 321 | True Detective | 2014 | -0.08961 | 8.9 | 30 |
| 322 | Altered Carbon | 2018 | -0.1064 | 7.9 | 18 |
| 323 | Guillermo del Toro’s Cabinet of Curiosities | 2022 | -0.10952 | 7.0 | 8 |
| 324 | The Witcher | 2019 | -0.14361 | 8.0 | 24 |
I know I said earlier that I do not want to filter shows by their episode count, but I still want to see what the ratings are for shows that are long running, seeing as they take the most investment. Here is the data for shows that have the same filters, but also have 30 episodes or more.
| Position | Title | Year | M Score | IMDB | Episode Count |
|---|---|---|---|---|---|
| 1 | Star Trek: Picard | 2020 | 0.04841 | 7.5 | 30 |
| 2 | Gravity Falls | 2012 | 0.03348 | 8.9 | 41 |
| 3 | Succession | 2018 | 0.03241 | 8.8 | 39 |
| 4 | Castlevania | 2017 | 0.03156 | 8.3 | 32 |
| 5 | Jujutsu Kaisen | 2020 | 0.02662 | 8.6 | 47 |
| 6 | Code Geass | 2006 | 0.02631 | 8.7 | 50 |
| 7 | Black Sails | 2014 | 0.02184 | 8.2 | 38 |
| 8 | Spartacus | 2010 | 0.02099 | 8.5 | 33 |
| 9 | Mr. Robot | 2015 | 0.02066 | 8.5 | 45 |
| 10 | The Orville | 2017 | 0.02008 | 8.0 | 36 |
| 11 | Avatar: The Last Airbender | 2005 | 0.01925 | 9.3 | 62 |
| 12 | Bates Motel | 2013 | 0.01818 | 8.1 | 50 |
| 13 | The Killing | 2011 | 0.01784 | 8.3 | 44 |
| 14 | Banshee | 2013 | 0.01757 | 8.4 | 38 |
| 15 | Fullmetal Alchemist: Brotherhood | 2009 | 0.01744 | 9.1 | 64 |
| 16 | Barry | 2018 | 0.01705 | 8.4 | 32 |
| 17 | BoJack Horseman | 2014 | 0.01701 | 8.8 | 77 |
| 18 | Breaking Bad | 2008 | 0.01627 | 9.5 | 62 |
| 19 | Schitt’s Creek | 2015 | 0.01254 | 8.5 | 80 |
| 20 | Hannibal | 2013 | 0.01239 | 8.5 | 39 |
| 21 | Demon Slayer: Kimetsu no Yaiba | 2019 | 0.01169 | 8.6 | 55 |
| 22 | Better Call Saul | 2015 | 0.0116 | 9.0 | 63 |
| 23 | Daredevil | 2015 | 0.01156 | 8.6 | 39 |
| 24 | Shadowhunters | 2016 | 0.0112 | 6.5 | 55 |
| 25 | Star Wars: Rebels | 2014 | 0.01089 | 8.1 | 73 |
| 26 | Veep | 2012 | 0.00892 | 8.4 | 65 |
| 27 | Vinland Saga | 2019 | 0.00877 | 8.8 | 48 |
| 28 | Justified | 2010 | 0.00829 | 8.6 | 78 |
| 29 | The Wire | 2002 | 0.00826 | 9.3 | 60 |
| 30 | Poirot | 1989 | 0.00812 | 8.6 | 70 |
| 31 | The Legend of Korra | 2012 | 0.00782 | 8.3 | 52 |
| 32 | Louie | 2010 | 0.00781 | 8.5 | 61 |
| 33 | The Last Kingdom | 2015 | 0.00778 | 8.5 | 46 |
| 34 | Star Wars: The Bad Batch | 2021 | 0.0074 | 7.8 | 37 |
| 35 | Attack on Titan | 2013 | 0.00712 | 9.1 | 89 |
| 36 | Star Trek: Enterprise | 2001 | 0.00694 | 7.5 | 98 |
| 37 | Star Wars: The Clone Wars | 2008 | 0.00675 | 8.4 | 133 |
| 38 | Merlin | 2008 | 0.00645 | 7.9 | 65 |
| 39 | The Grand Tour | 2016 | 0.0063 | 8.7 | 45 |
| 40 | Person of Interest | 2011 | 0.00618 | 8.5 | 103 |
| 41 | Narcos | 2015 | 0.0061 | 8.8 | 30 |
| 42 | Mad Men | 2007 | 0.00606 | 8.7 | 92 |
| 43 | The Strain | 2014 | 0.00606 | 7.3 | 46 |
| 44 | Boardwalk Empire | 2010 | 0.00581 | 8.6 | 56 |
| 45 | The Americans | 2013 | 0.00568 | 8.4 | 75 |
| 46 | Hunter x Hunter | 2011 | 0.00555 | 9.0 | 148 |
| 47 | Ash vs Evil Dead | 2015 | 0.00554 | 8.4 | 30 |
| 48 | Deadwood | 2004 | 0.00523 | 8.6 | 36 |
| 49 | Six Feet Under | 2001 | 0.00518 | 8.7 | 63 |
| 50 | Battlestar Galactica | 2004 | 0.00473 | 8.7 | 74 |
| 51 | … | ||||
| 206 | Love, Death & Robots | 2019 | -0.00658 | 8.4 | 35 |
| 207 | Weeds | 2005 | -0.00667 | 7.9 | 102 |
| 208 | Shameless | 2011 | -0.00706 | 8.5 | 134 |
| 209 | Supergirl | 2015 | -0.00723 | 6.2 | 126 |
| 210 | Naruto | 2002 | -0.00808 | 8.4 | 220 |
| 211 | The Rookie | 2018 | -0.00883 | 8.0 | 101 |
| 212 | Two and a Half Men | 2003 | -0.0089 | 7.1 | 262 |
| 213 | Prison Break | 2005 | -0.00923 | 8.3 | 90 |
| 214 | Doctor Who | 2005 | -0.00926 | 8.6 | 163 |
| 215 | Top Gear | 2002 | -0.00943 | 8.7 | 244 |
| 216 | The Last Ship | 2014 | -0.00962 | 7.4 | 56 |
| 217 | The Handmaid’s Tale | 2017 | -0.00975 | 8.4 | 56 |
| 218 | Californication | 2007 | -0.00988 | 8.3 | 84 |
| 219 | Dexter | 2006 | -0.01001 | 8.7 | 96 |
| 220 | Vikings | 2013 | -0.01047 | 8.5 | 89 |
| 221 | True Blood | 2008 | -0.01162 | 7.9 | 81 |
| 222 | The Crown | 2016 | -0.01194 | 8.6 | 60 |
| 223 | Star Trek | 1966 | -0.01274 | 8.4 | 80 |
| 224 | Designated Survivor | 2016 | -0.01277 | 7.4 | 53 |
| 225 | Game of Thrones | 2011 | -0.0133 | 9.2 | 74 |
| 226 | The Flash | 2014 | -0.01331 | 7.5 | 184 |
| 227 | You | 2018 | -0.01487 | 7.7 | 40 |
| 228 | American Horror Story | 2011 | -0.01547 | 8.0 | 128 |
| 229 | Jessica Jones | 2015 | -0.01563 | 7.9 | 39 |
| 230 | Narcos: Mexico | 2018 | -0.0158 | 8.4 | 30 |
| 231 | Riverdale | 2017 | -0.01617 | 6.5 | 137 |
| 232 | Heroes | 2006 | -0.01632 | 7.5 | 80 |
| 233 | Arrested Development | 2003 | -0.01663 | 8.7 | 84 |
| 234 | Fear the Walking Dead | 2015 | -0.01669 | 6.8 | 113 |
| 235 | Billions | 2016 | -0.01703 | 8.3 | 84 |
| 236 | Money Heist | 2017 | -0.01955 | 8.2 | 41 |
| 237 | Rick and Morty | 2013 | -0.01964 | 9.1 | 71 |
| 238 | The Umbrella Academy | 2019 | -0.02129 | 7.9 | 30 |
| 239 | Tom Clancy’s Jack Ryan | 2018 | -0.0226 | 8.0 | 30 |
| 240 | Fargo | 2014 | -0.02367 | 8.9 | 51 |
| 241 | Death Note | 2006 | -0.02423 | 8.9 | 37 |
| 242 | Chilling Adventures of Sabrina | 2018 | -0.02524 | 7.4 | 36 |
| 243 | Twin Peaks | 1990 | -0.02612 | 8.8 | 30 |
| 244 | Westworld | 2016 | -0.02985 | 8.5 | 36 |
| 245 | The Morning Show | 2019 | -0.03081 | 8.2 | 30 |
| 246 | Titans | 2018 | -0.03172 | 7.5 | 49 |
| 247 | The Sinner | 2017 | -0.03383 | 7.9 | 32 |
| 248 | Doom Patrol | 2019 | -0.03467 | 7.7 | 46 |
| 249 | House of Cards | 2013 | -0.03584 | 8.6 | 73 |
| 250 | Sex Education | 2019 | -0.03898 | 8.3 | 32 |
| 251 | Star Trek: Discovery | 2017 | -0.04022 | 7.1 | 55 |
| 252 | Elite | 2018 | -0.04591 | 7.2 | 56 |
| 253 | 13 Reasons Why | 2017 | -0.04865 | 7.5 | 49 |
| 254 | Killing Eve | 2018 | -0.07429 | 8.1 | 32 |
| 255 | True Detective | 2014 | -0.08961 | 8.9 | 30 |